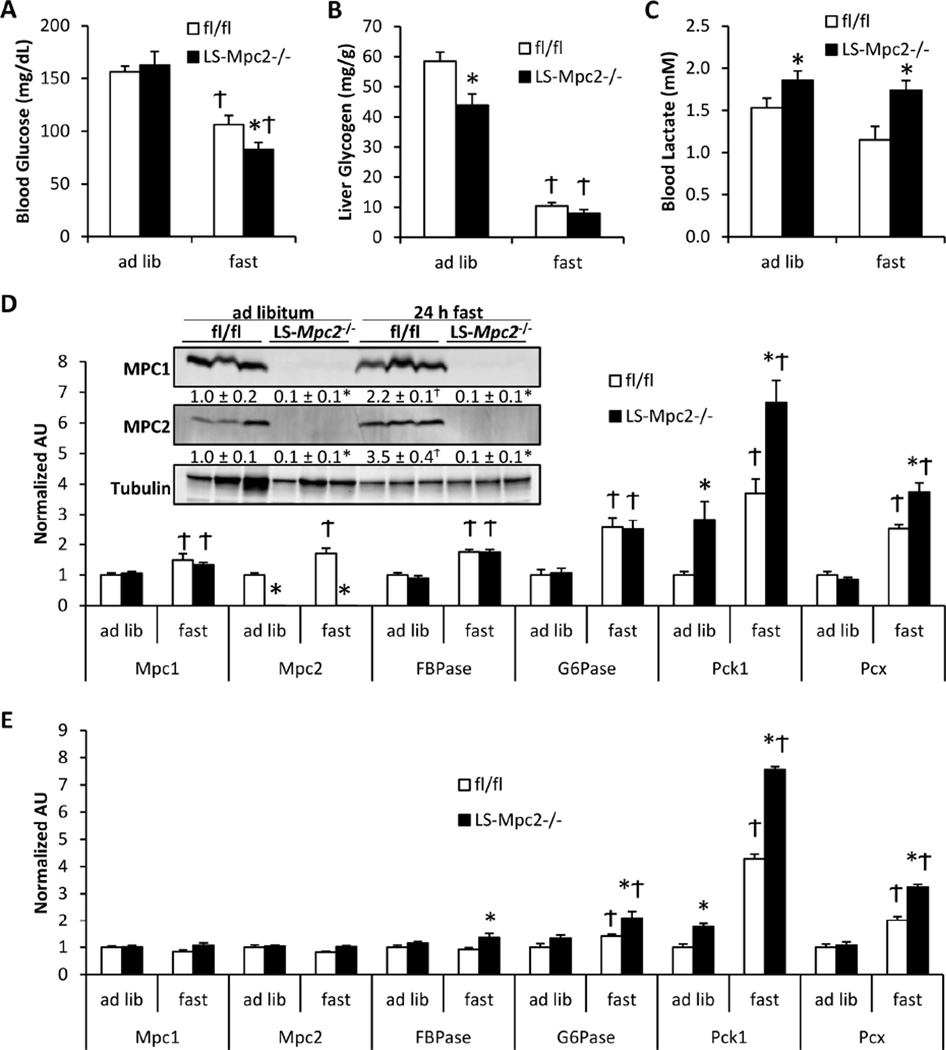
Figure 4. Fasting response of LS Mpc2−/− mice.
LS-Mpc2−/− and fl/fl mice were either given ad libitum access to food or fasted 24 h. Graphs depict (A) blood glucose concentration, (B) liver glycogen, and (C) blood lactate concentration. (D) qRT-PCR analyses in livers from fed vs. fasted fl/fl and LS-Mpc2−/− mice. Inset: western blot of liver lysates from fed and fasted mice, with quantification in text below blot. (E) qRT-PCR analyses of kidneys from fed vs. fasted fl/fl and LS-Mpc2−/− mice. Data presented as mean + S.E.M. *p ≤ 0.05 for fl/fl vs. LS-Mpc2−/−. Ϯp ≤ 0.05 for fed vs fasted.

