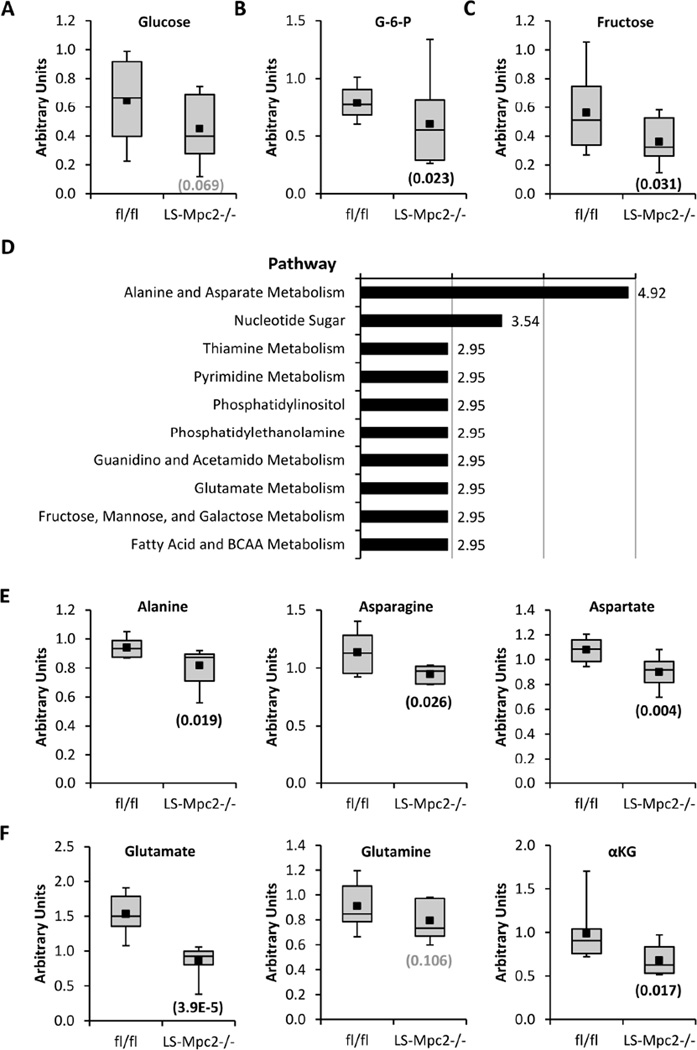
Figure 5. Metabolomic analyses of fasted fl/fl and LS-Mpc2−/− livers.
Liver (A) glucose, (B) glucose-6-phosphate (G-6-P), and (C) fructose content in fasted LS-Mpc2−/− compared to fl/fl mice. (D) Metabolic pathways that were most significantly affected by genotype in fasted mouse liver. (E) Alanine, asparagine, and aspartate content and (F) glutamate, glutamine, and alpha-ketoglutarate (αKG), content in fasted LS-Mpc2−/− and fl/fl livers. Data presented as box and whisker plot with minus error bar as the minimum of distribution, bottom of box as lower quartile, line bisecting the box as the median, the black square as the mean, the top of the box as the upper quartile, and the positive error bar as the maximum of distribution. Number in parentheses is p value for fasted fl/fl vs LS-Mpc2−/− liver metabolite.

