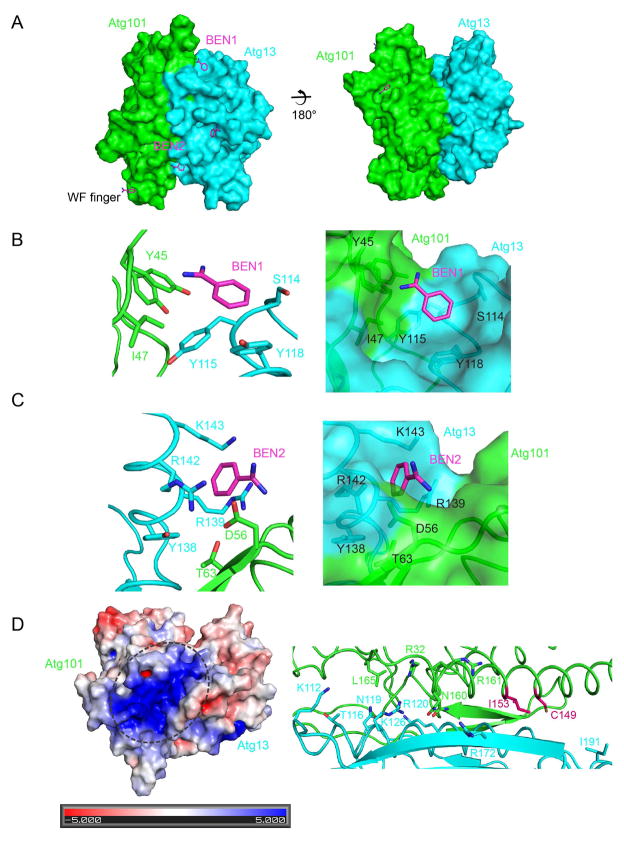
FIGURE 6. Benzamidine binding sites mark hydrophobic pockets.
(A) Overall view of the locations of five benzamidine molecules. The complex of Atg101 and Atg13 is shown in a surface model and benzamidines are shown as a stick model. The WF finger is indicated. (B, C) Details of the environment of benzamidine molecules 1 and 2 are shown in cartoon (left) and surface (right) models. Benzamidines and highlighted residues are shown in a stick model. (D) Left: the electrostatic surface was generated at a saturating color level of ±5 kT/e. Right, residues located in the positive groove are shown in a stick model.

