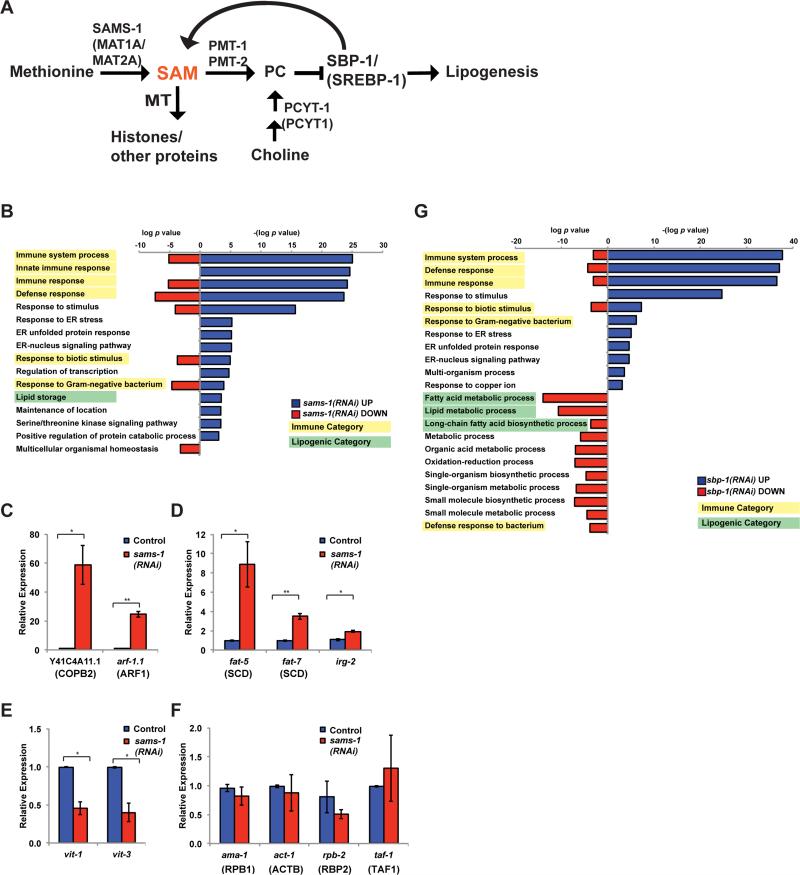
Figure 1. Co-regulation of lipogenic and immune function genes with depletion of SAM.
A. Schematic showing C. elegans pathways producing or utilizing SAM. MT is methyltransferase, SAM is s-adenosylmethionine, PC is phosphatidylcholine. Human names for orthologs are shown in parenthesis, see also Table S1. B. Bar graphs comparing p-values for GO categories of genes regulated more than 2.0 fold after sams-1(RNAi). Downregulated genes are shown in red bars as log p value. To distinguish upregulated genes, -(log p value) was used for blue bars. Immune categories are highlighted in yellow, lipogenic in green. Genes are identified in Table S2, tab: GO Categories. Genes that were upregulated (C-D), down regulated (E) or not changed in microarray studies were validated in qRT-PCR standardized to an exogenous “spike in” mRNA. G. Bar graphs comparing p-values for GO categories of genes regulated more than 2.0 fold after sbp-1(RNAi). Downregulated genes are shown in red bars as log p value. To distinguish upregulated genes, -(log p value) was used for blue bars. Immune categories are highlighted in yellow, lipogenic in green. Genes are identified in Table S3, tab: GO Categories.

