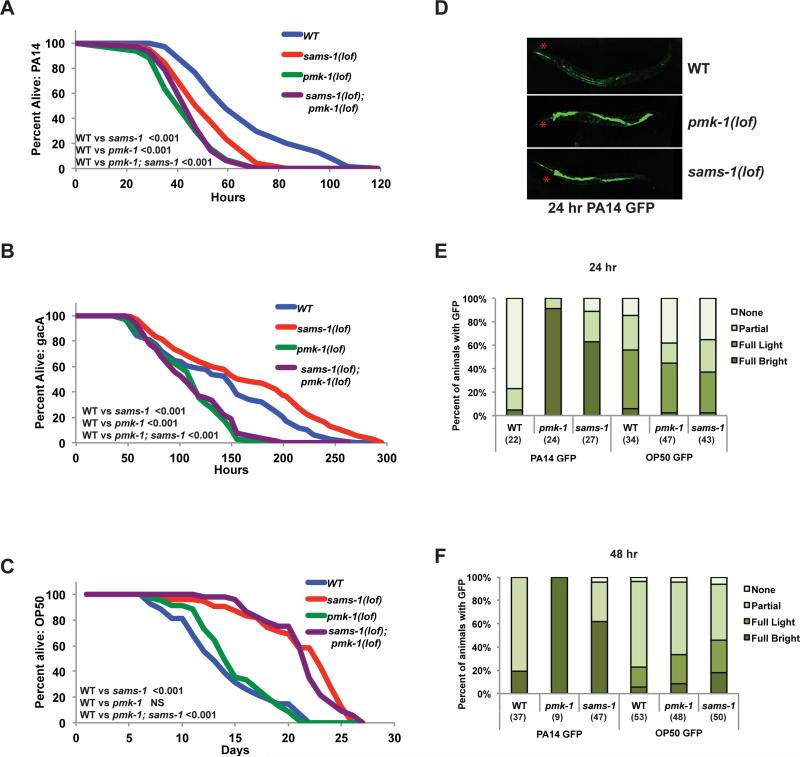
Figure 4. Reduced resistance to Pseudomonas aeruginosa in sams-1(lof) animals.
Representative Kaplan-Meir plot comparing survival of (WT), sams-1(lof), pmk-1(lof) and pmk-1(lof); sams-1(lof) mutants exposed to pathogenic Pseudomonas aeruginosa, PA14 (A), the attenuated Pseudomonas strain gacA (B) or E. coli OP50 (C). NS is not significant. Additional statistics are available in Table S4. All strains in panels A, B, and C were raised on cdc-25(RNAi) to prevent egg laying. D. Fluorescent micrograph showing Pseudomonas load (PA14 GFP) after 24 hour exposure in intestines of wild type, pmk-1(lof) and sams-1(lof) mutants. Red asterisks show pharynx position. Representative experiments showing quantitation of PA14 GFP and OP50 GFP after 24 (E) or 48 (F) hours exposure. Number of animals is shown in parentheses. “Partial” refers to light GFP in a section of the intestine, “full light” to light GFP along the length of the intestine and “full bright” to strong GFP in the entire intestinal tract.

