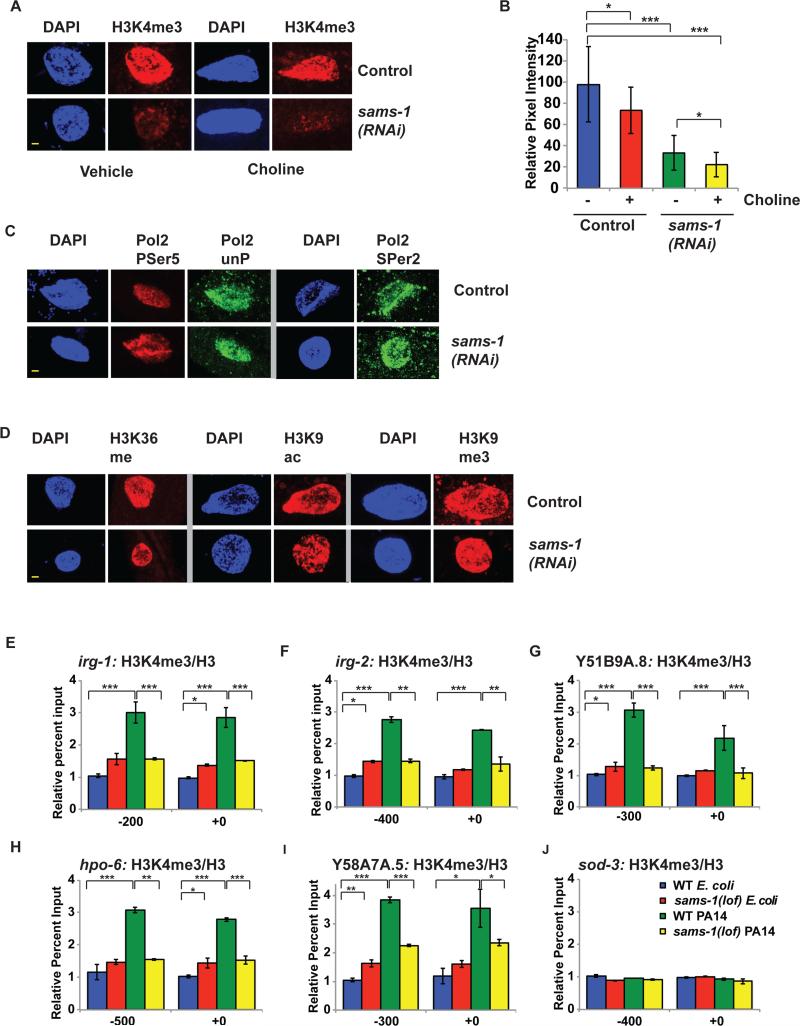
Figure 6. Infection response genes do not accumulate activating histone methylation marks in sams-1(lof) mutants exposed to Pseudomonas.
A. H3K4me3 is diminished in nuclei of intestinal cells after sams-1(RNAi) and also in choline treated sams-1(RNAi). Yellow bar shows 2 microns. B. Quantitation of immuoflourescence showing an average of pixel intensity over area for 8-12 nuclei per sample. C. Immunostaining comparing markers of active phosphorylated RNA Polymerase II (Pol II PSer 5, PSer 2) with total Pol II (unP) See Figure S2 for quantitation. D. Other histone modifications associated with active transcription (H3K36me and H3K9ac) or with heterochromatin (H3K9me3) within intestinal nuclei in control or sams-1(RNAi) animals. See Figure S2 for quantitation. E-J. Chromatin immunoprecipitation comparing levels of H3K4me3 on infection response or control genes grown on E. coli (OP50) or Pseudomonas (PA14) in wild-type (WT) or sams-1(lof) mutants. Input levels were normalized to the WT E. coli value on the upstream primer pair. Numerical representation of primer location is based on translational start site. Legend in J refers to all panels. Error bars show standard deviation. Results from Student's T test shown by * <0.05, ** <0.01, *** <0.005.

