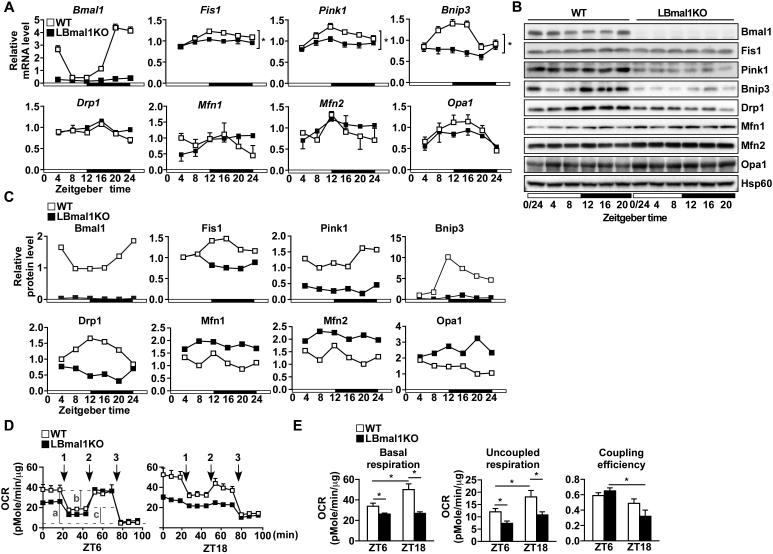
Figure 1. Rhythmic expression of mitochondrial dynamics genes in the liver is regulated by Bmal1.
(A) Diurnal mRNA expression of genes involved in mitochondrial dynamics in WT and LBmal1KO livers determined by real-time PCR. (B) Western blot analyses of mitochondrial dynamics proteins throughout the day. Liver samples were collected every 4 hours for 24 hours. Pooled samples (n=3-4/time point/genotype, see also Table S4) were used for each time point. The white and black bar represents light cycle and dark cycle, respectively. Zeitgeber time ZT0: lights on; ZT12: lights off. (C) Western blot signals in (B) were quantified and normalized to the loading control (Hsp60). (D) Bioenergetics assays in hepatocytes from control and LBmal1KO mice isolated at ZT6 and ZT18. Numbers 1-3 refer to the time course of adding oligomycin, FCCP, and antimycin A/rotenone. a, b and c in ZT6 WT hepatocytes indicate the basal oxygen consumption rate (OCR), ATP turnover and uncoupled respiration (proton leak), respectively. (E) The basal OCR, uncoupled respiration, and coupling efficiency (ATP turnover/basal OCR) calculated based on data in (D). Data presented as mean ± SEM. *p<0.05.

