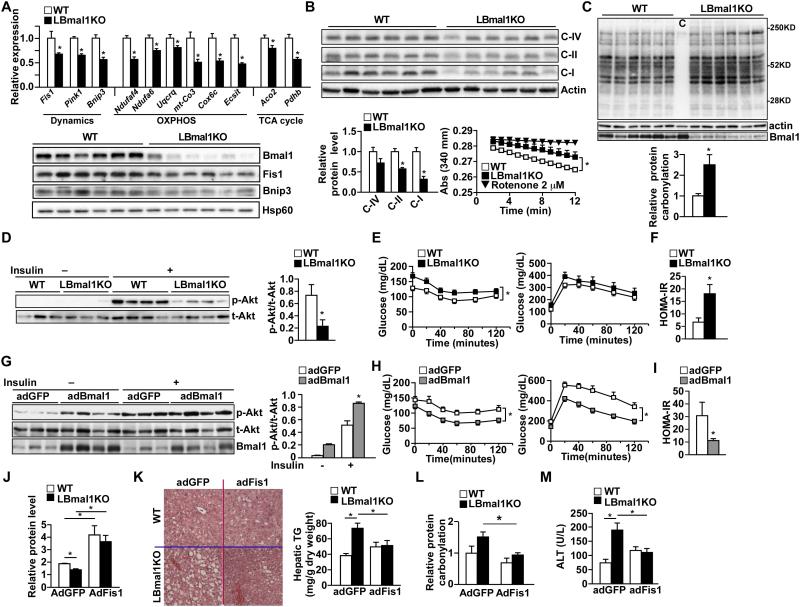
Figure 6. Hepatic Bmal1 regulates oxidative stress, lipid homeostasis, and insulin response.
(A) Expression of Bmal1 targets involved in mitochondrial function in liver from WT and LBmal1KO mice on high fat diet (HFD) for 5 months. Samples were collected at ZT12 (n=6/genotype). Upper panel: mRNA expression determined by real-time PCR. Lower panel: Western blot analyses. (B) OXPHOS protein levels in livers from HFD fed WT and LBmal1KO mice (n=6/genotype). Upper panel: Western blot analysis. C-I, II, and IV: ETC complex I (Ndufa9), II (Sdha), and IV (Cox4). Lower left panel: quantification of protein levels normalized to actin. Lower right panel: Complex I activity using mitochondria isolated from livers of WT and LBmal1KO mice. Rotenone is used as a negative control. (C) Oxidative damage assessed by levels of protein carbonylation in liver lysate from WT and LBmal1KO mice (n=6) fed a HFD for 5 months using Western blotting. c: negative control liver lysate from a WT mouse omitting DNPH substrates. Quantification normalized to actin is shown at the lower panel. (D) Western blot analyses of hepatic insulin signaling. Akt phosphorylation was examined in livers collected prior to and 5 min after insulin injection (n=3-4). The level of insulin-stimulated phospho-Akt (p-Akt) was quantified and normalized to that of the total Akt (t-Akt, right panel). (E) ITT (left) and GTT (right) in high fat fed WT and LBmal1KO mice (n=7-8). (F) The HOMA-IR assessment. (G) Western blot analyses of liver insulin signaling in high fat fed control (adGFP) and hepatic Bmal1 over-expression (adBmal1) mice (n=3-4) (H-I) ITT, GTT, and HOMA-IR in adGFP and adBmal1 mice (n=5-6). (J)-(M) Effect of hepatic Fis1 overexpression in WT and LBmal1KO mice. Mice (HFD fed for 5 months; n=6/genotype) were given adGFP (control) or adFis1 for 1 week. (J) Quantification of hepatic Fis1 protein levels. (K) Left panel: liver histology with H & E staining; Right panel: hepatic triglyceride (TG) content. (L) Relative protein carbonylation in liver samples (n=4, see also Figure S5G). (M) Serum alanine aminotransferase (ALT) activity. Data presented as mean ± SEM. *p<0.05.

