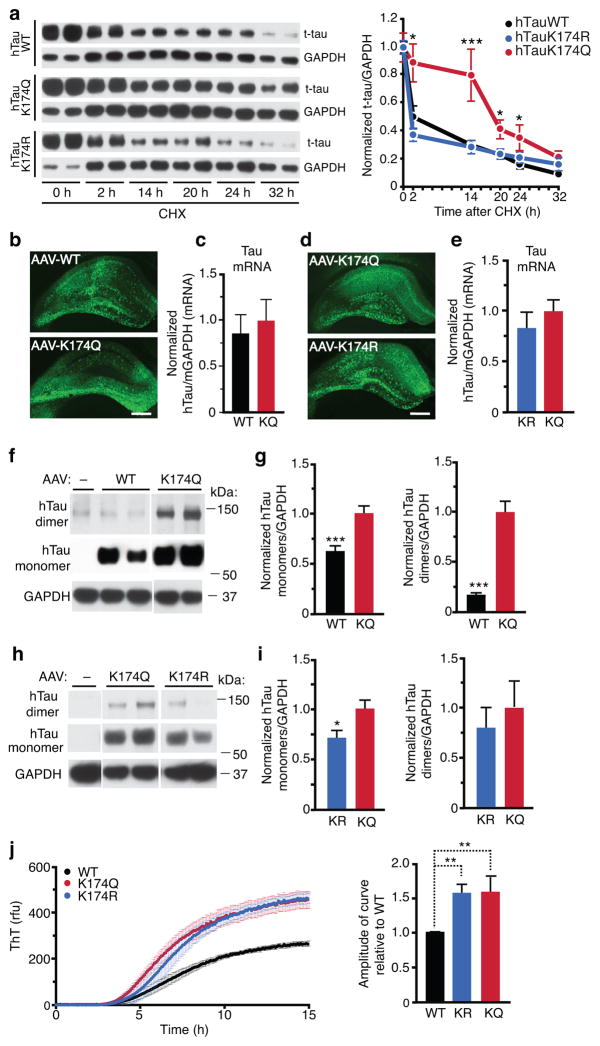
Figure 2. Acetyl-Mimic K174Q Leads to Tau Accumulation In Vitro and In Vivo.
(a) K174Q tau had longer half-life than WT or K174R tau. Primary neurons were infected with lenti-WT, K174Q or K174R tau for four days before CHX treatment. (left) Representative immunoblot of WT, K174Q or K174R tau in primary neurons treated with CHX for 0–32 hours. (right) Quantification of WT, K174Q, or K174R tau turnover. n=15, n=8, n=8, from 4 independent experiments. Levels of tau were normalized to those of GAPDH at different time points. * p < 0.05, K174Q vs WT at 2, 20, or 24 h. *** p<0.001, at 14 h. One-way ANOVA, Tukey-Kramer post hoc analyses. (b, d) Representative images showing HT7 immunostaining of hippocampus 10 days after injection of equal amounts of AAV-WT vs. K174Q tau (b), or AAV-K174Q vs. AAV-K174R tau (d). Scale bar=500 μm. (c, e) qRT-PCR showing similar levels of human tau mRNA are transduced three months after the infection. GAPDH was used as internal control. (c) n=10 (for WT), 12 (for K174Q). Mann-Whitney non-parametric test. (e) n=9 (for K174R and K174Q), unpaired student t-test. (f,g) K174Q mutation elevated levels of tau monomers and dimers. (f) Representative immunoblot with HT7 showing tau monomers and putative dimers in hippocampus injected with AAV-WT or AAV-K174Q. (g) Quantification of tau monomers (left) and tau dimers (right). n=11 (WT), n=12 (K174Q). *** p < 0.001, unpaired student t-test. (h,i) K174R mutation elevates tau dimers as K174Q, but not monomers. (h) Representative immunoblot with HT7 showing monomeric tau and putative tau dimers in hippocampus injected with AAV-K174Q or AAV-K174R tau. (i) Quantification of tau monomers (left) and dimers (right). n=9/genotype. * p < 0.05, unpaired student t-test. (j) In vitro aggregation analyses of recombinant WT, K174Q and K174R. (left) Tau aggregation kinetics was assayed by Thioflavin T fluorescence following the addition of heparin. (right) Amplitude of curve obtained from parameters fit to the Gompertz equation. ** p < 0.01, one-way ANOVA, Tukey-Kramer post hoc analyses from three independent experiments. KQ=K174Q tau, KR=K174R tau. Values are means ± SEM (a,c,e,g,i,j). WT, wild-type.

