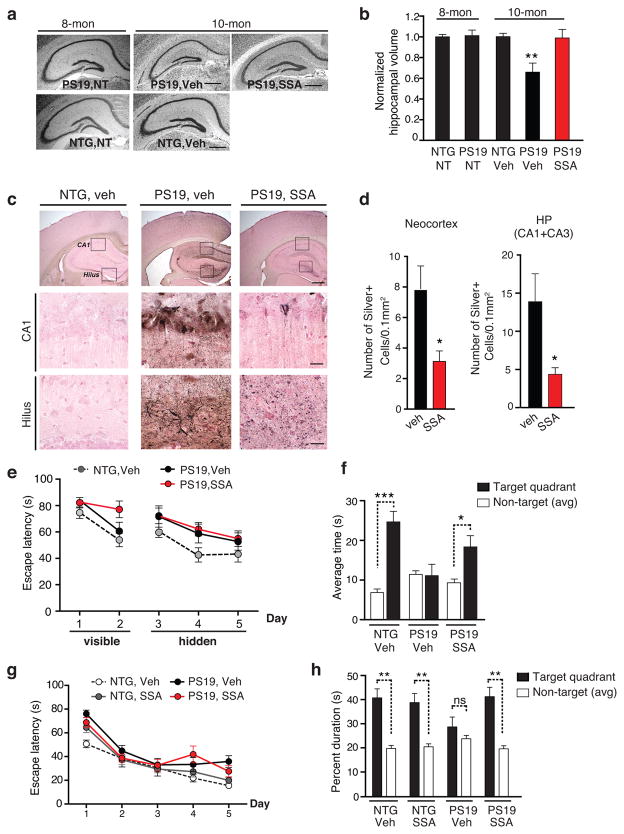
Figure 5. Salsalate Treatment Prevents Hippocampi Atrophy, Reduces Tau Pathology and Rescues Spatial Memory Deficits in PS19 Mice.
(a–b) SSA treatment prevented hippocampal volume loss. (a) Representative nissl staining of hippocampus from 8-month-old NTG and PS19 mice before the treatment (non-treated, NT), 10 month-old vehicle-treated NTG, vehicle- or SSA-treated PS19 mice. Scale bar, 500 μm. (b) Quantification of hippocampal volume. n=6 (NTG, NT), 9 (PS19, NT), 8 months old. n=9 (female NTG, veh), 6 (female PS19, veh), 6 (female PS19, SSA), 10–11 months old, ** p < 0.01, one-way ANOVA, Tukey-Kramer post hoc analyses. (c–d) SSA treatment reduced NFTs in PS19 mice. (c) Example of Gallyas staining images of vehicle-treated female NTG mice, and female PS19 mice treated with vehicle or SSA. Scale bar: 250 μm (upper); 25 μm (middle, lower) (d) Quantification of silver-positive cells or neurites in neocortex and hippocampus (CA1+CA3) of vehicle- or SSA treated PS19 mice. n=8 mice/genotype/treatment, 10–11 months old, * p < 0.05, unpaired student t-test. (e–h) SSA treatment ameliorated spatial memory loss in fixed-location dry maze and in MWM. (e) No significant difference in learning rate was observed among the groups in fixed location dry maze; Day 1–2, training with visible hole; Day 3–5, learning with hidden hole. (f) NTG or SSA-treated PS19 mice, but not vehicle-treated PS19 mice, showed preference to the target quadrant. n=10 (female NTG, veh), 8 (female PS19, veh), 8 (female PS19, SSA), 10–11 months old. (g) Learning rate did not differ among the groups in MWM. (h) SSA treatment restored spatial memory deficits in PS19 mice. NTG or SSA-treated PS19 mice, but not vehicle-treated PS19 mice, showed preference to the target quadrant. n=13 (male NTG, veh), 15 (male NTG, SSA), 11 (male PS19, veh), 10 (male PS19, SSA), 9–10 months old. The multilevel mixed-effects linear regression model was used to assess the learning curve (e, g). *** p < 0.001, ** p <0.01, * p <0.05, paired student t-test. Values are means ± SEM (b, d, e–h). NTG, non-transgenic.

