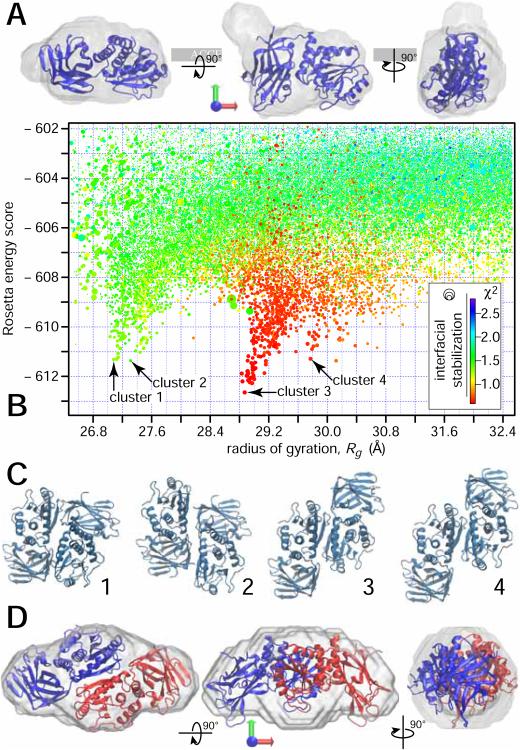
Figure 2.
Structural modeling the decomposed SAXS results. (A) Reconstructed envelope of scattering density for the PTEN monomer in solution with a ribbon model of the truncated crystal structure (Lee et al., 1999) superimposed. When docked to the membrane, the direction of the membrane normal coincides with the green arrow. two orthogonal rotations transform the view shown in the center into the views to the right and the left. (B) Rosetta score vs. Rg for trial configurations from global and local Rosetta runs that yielded a Rosetta energy score ≤ −602, and a radius of gyration 26.6 Å ≤ Rg ≤ 32.6 Å. The symbol color encodes the fit quality (χ2) between the SAXS curves calculated from the configurations and the experimental SAXS curve obtained for the putative dimer from the decomposition. Because the error bars are slightly overestimated by the data reduction software provided by the facility, the best models show χ2 values below unity. The symbol size represents the interfacial energy score Isc from Rosetta. All symbols larger than the minimum size have interfacial energies that are considered ‘good’ with values 5 ≤ Isc ≤ 10. The score funnel at Rg = 29 Å yields the globally lowest Rosetta scores and the best fit to the data. (C) Graphical representation of configurations with the lowest Rosetta scores for the four score funnels indicated in panel (B). (D) Reconstructed envelope of scattering density for the large particle obtained from the decomposition, as in panel (A). The PTEN dimer corresponding to configuration 3 in panel (B) is superimposed as a ribbon structure.

