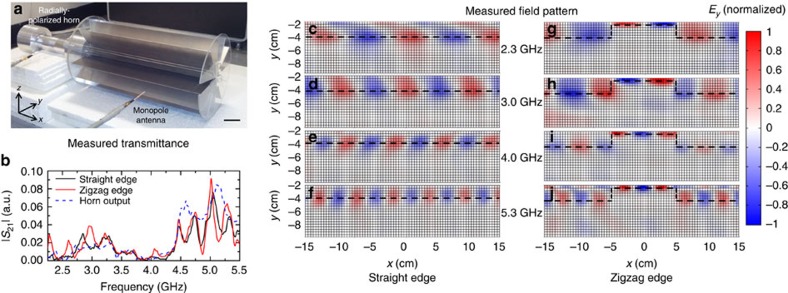
Figure 6. Experimental indication of a pseudospin-polarized waveguide.
(a) The experimental set-up. Scale bar, 5 cm. EM wave was emitted from a radially polarized horn on the left of the sample. The electric field inside the sample was measured with a monopole antenna mounted on a stepmotor. (b) Measured transmittance of the sample with a straight edge (black line) or a zigzag edge (red line). The shifted region in the zigzag edge did not introduce obvious backscattering. Robust transport was also verified by the measured Ey field patterns. (c–f) Measured Ey fields in the sample with straight edges at 2.3, 3.0, 4.0 and 5.3 GHz. (g–j) Measured Ey fields in the sample with zigzag edge. Black dashed lines highlight the locations of edges. EM waves were always guided along the straight or zigzag edge. The field amplitudes on the left and right of the zigzag edge are almost the same, indicating robust transport. The fields in the shifted region were enhanced, compared with the unshifted region. The measured field patterns at each frequency are normalized by the maximal amplitude in the zigzag edge.

