FIG 4.
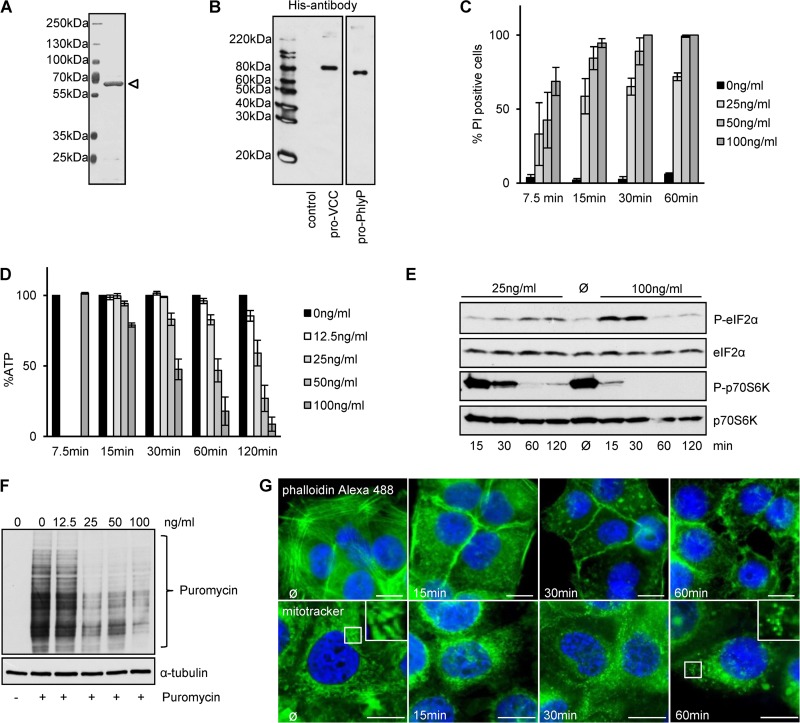
Recombinant pro-PhlyP (pPhlyP) reproduces cytotoxic effects observed with native PhlyP. (A) SDS-PAGE analysis of affinity-purified N-terminally His6×-tagged pPhlyP (indicated by an open triangle). (B) Purified N-terminally His6×-tagged pVCC and pPhlyP were analyzed by Western blotting with anti-His antibodies. (C) HaCaT cells were incubated as indicated with different doses of pPhlyP (recombinant) for the indicated times and then stained with PI. The graph shows percentages of PI-positive cells out of the total cell number (mean values ± SE [n = 3]). (D) HaCaT cells were incubated with the indicated doses of His6×-tagged pPhlyP. Cellular ATP levels were determined at the indicated times. Data are percentages of the values in untreated controls and are mean values ± SE (n ≥ 5 for 15, 30, 60, and 120 min; n = 4 for 7.5 min). (E) HaCaT cells were incubated or not with 25 ng/ml or 100 ng/ml His6×-tagged pPhlyP for the indicated times. Lysates were analyzed by Western blotting for P-eIF2α, eIF2α, P-p70S6K, and p70S6K. (F) HaCaT cells were incubated or not with different doses of His6×-tagged pPhlyP for 1 h. Subsequently, cells were incubated or not for 1 h at 37°C with 10 μg/ml puromycin, which is incorporated into nascent proteins (69). Cells were analyzed by Western blotting for puromycin and α-tubulin. (G) HaCaT cells were incubated for the indicated times with 100 ng/ml His6×-tagged pPhlyP and then either washed, fixed, and treated with 0.1% Triton X-100 prior to staining with phalloidin-Alexa 488 (upper panels) or washed and treated with MitoTracker Green FM (200 nM) for 30 min at 37°C (lower panels). Bars = 20 μm.

