
Figure 1.
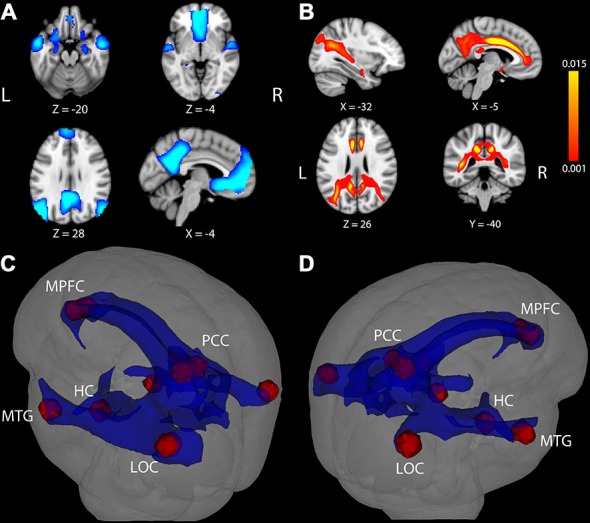
Task-induced deactivation in the default mode network (DMN) and DMN white matter (WM) pathways. (A) Regions showing significant deactivation at FWE-corrected p < 0.05. (B) Statistical map of probabilistic tractography indicating the proportion of streamlines passing through each voxel. The scale indicates a minimum value of 0.001 (0.1%) of all attempted streamlines passing through a given voxel, while the maximum was set at 0.015 (1.5%) of all attempted streamlines passing through a given voxel. Coordinate below each image is the MNI coordinate for that slice. (C,D) WM pathways (blue) connecting DMN regions (red) after averaging the entire group and thresholding at 0.1% of all streamlines attempted passing through a voxel. The WM pathways shown in blue were used to extract fractional anisotropy (FA) in each participant. LOC, lateral occipital cortex; MTG, middle temporal gyrus; HC, hippocampus; PCC, posterior cingulate cortex; MPFC, medial prefrontal cortex.