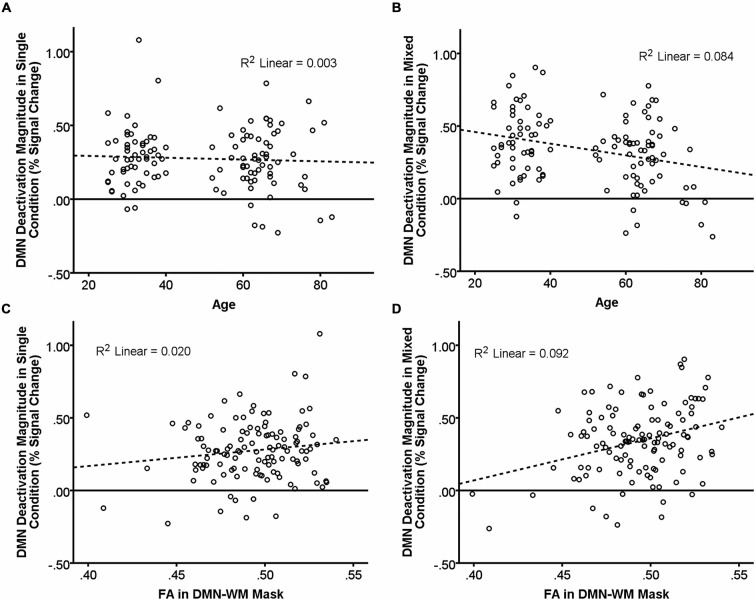
Figure 2.
Relationship of age and DMN WM microstructure with task-induced deactivation. The scatter plots show DMN deactivation magnitude in the single and mixed conditions (greater positive values = greater deactivation) plotted against age (A,B) and FA in the DMN-WM mask (C,D). Neither age (A) nor FA in the DMN-WM mask (C) correlated with task-induced deactivation in the single condition. Age (B) was negatively correlated and FA in the DMN-WM mask (D) was positively correlated with deactivation magnitude in the mixed condition. Dashed lines represent the linear best fit of the data. R2 values indicate the portion of the total variance explained by the line.

