
Figure 2.
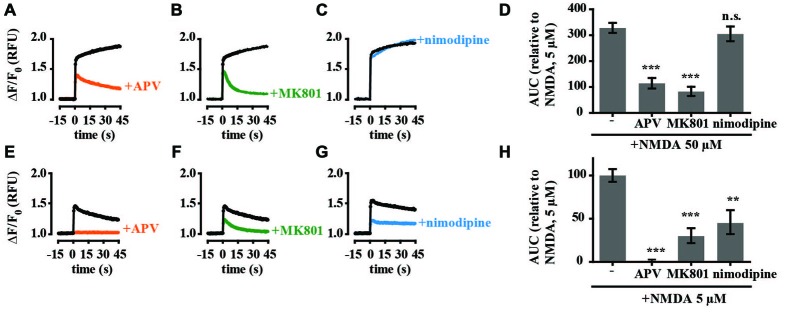
Calcium responses of cultured hippocampal neurons to high (50 μM) and low (5 μM) concentrations of NMDA are pharmacologically distinct. Hippocampal cultures were preincubated with antagonists for 15 min before recording calcium responses. Baseline Fluo-4 fluorescence was monitored for 15 s prior to the addition of NMDA (A–C, 50 μM NMDA; E–G, 5 μM NMDA) at time = 0, then monitored for a further 45 s. Raw fluorescence values were converted to ΔF/F0, where F0 is the average fluorescence over the first 15 s of recording prior to addition of agonist (baseline) and ΔF is Fmax−F0. Antagonists tested were amino-5-phosphonovalerate (APV) (A,E; 50 μM), MK-801 (B,F; 10 μM); nimodipine (C,G; 10 μM). (D,H) Responses were quantitated by measuring the AUC and are presented relative to the AUC for 5 μM NMDA (100%). RFU, Relative Fluorescent Units; **p < 0.005, ***p < 0.001. Error bar, SEM.