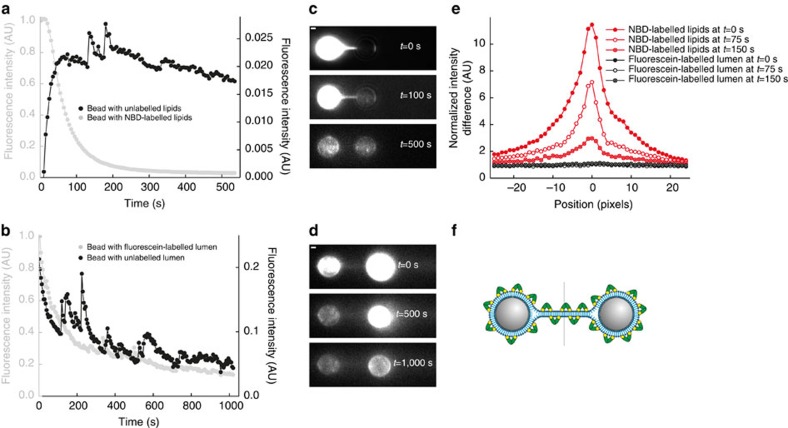
Figure 3. Membrane hemifusion.
(a) In the presence of fluorescent NBD-PE in a single membrane-coated bead, membrane stalk formation was accompanied by a strong fluorescence increase in the unlabelled membrane and a concurrent decrease in the labelled membrane. This phospholipid mixing indicates that either hemifusion or full membrane fusion occurred. Fluorescence intensities were normalized with respect to the initial intensity on the NBD-labelled bead. Even though stalk formation happens readily, to track lipid continuity and content mixing we require long-lived membrane stalks (>100 s). We measured two of those events. The small peaks in the signal are due to autofluorescent impurities in the buffer flow. (b) To distinguish between hemifusion and full fusion, we tested if membrane stalk formation allowed content mixing by coating the beads with nonfluorescent PC/PS liposomes while one of the beads was loaded with fluorescein in the liposomal lumen. On a timescale of 1,000 s, we did not detect a fluorescence increase in the unlabelled bead or membrane stalk, indicative for hemifusion. The decrease in fluorescence of the fluorescein-labelled bead is due to photobleaching. Fluorescence intensities were normalized with respect to the initial intensity on the fluorescein-labelled bead. In total, four of these events were measured. (c) Fluorescence images of bead pair in a at three different time points. Scale bar, 1 μm. (d) Fluorescence images of bead pair in b at three different time points. Scale bar, 1 μm. (e) Fluorescence intensity profiles along the dashed line indicated in f at three different time points. Intensities were averaged over 20 pixels perpendicular to the dashed line and normalized to the background signal. (f) Schematic representation of the hemifused configuration with Doc2b bound to the membrane surface.

