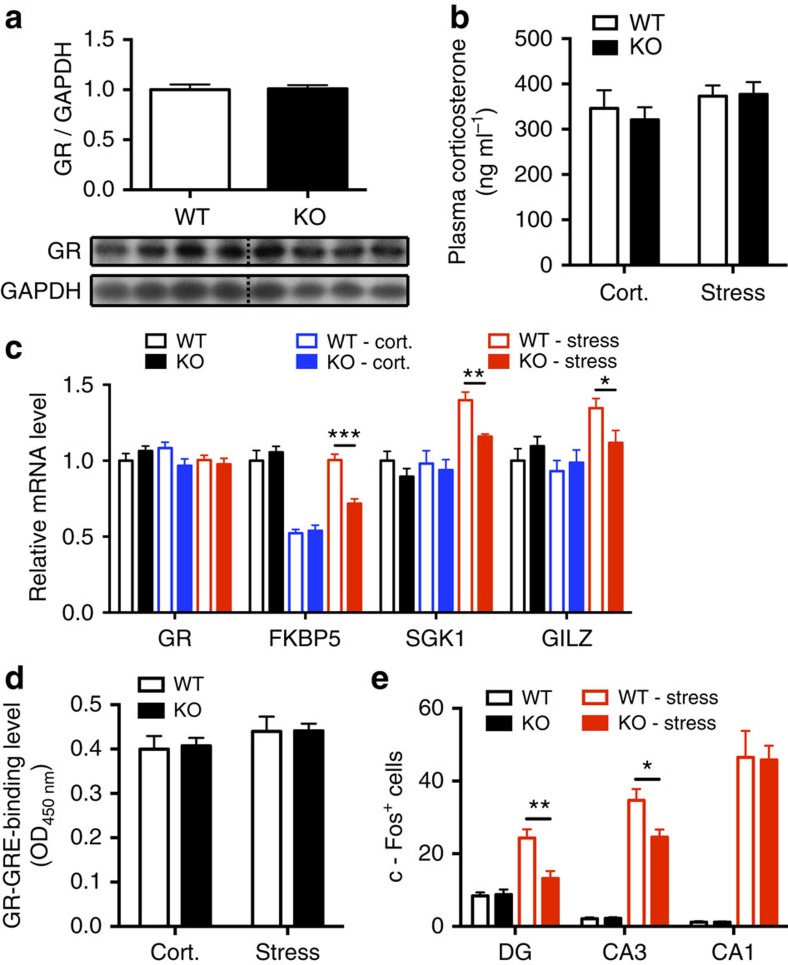
Figure 4. Mice with neurogenesis exhibit a greater response to stress in GR target gene expression and hippocampal neuronal activity assays.
(a) Western blot analysis of the GR protein level in the hippocampus does not show differences between KO and WT (n=7). (b) Mice were injected with 0.25 mg kg−1 corticosterone and corticosterone levels were measured 30 min after injection. No significant differences between WT and KO mice were observed (n=8–10). (c) The hippocampal gene expression of GR (Nr3c1) and GR target genes 30 min after stress or corticosterone injection were analysed by qRT–PCR. There were no differences in GR expression among all the groups. However, the gene expression of GR target genes is increased in WT mice compared with KO mice after stress (n=10 and 8, FKBP5, t16=5.61, P<0.0001; SGK1, t16=3.82, P=0.001; GILZ, t16=2.26, P=0.038), indicating that stress resulted in higher expression of GR target genes in mice that exhibit hippocampal neurogenesis. (d) GR-GRE-binding assay revealed no differences between WT and KO mice 30 min after corticosterone injection or restraint stress stimulation (n=8–9). (e) Ninety minutes after stress started, mice with neurogenesis depletion showed less c-Fos+ cells in the DG (n=8 and 7, t13=3.47, P=0.004) and CA3 (t13=2.64, P=0.02), but no difference in the CA1(t13=0.08, P=0.93). Student's t-test, values represent mean±s.e.m. *P<0.05, **P<0.01, ***P<0.001.

