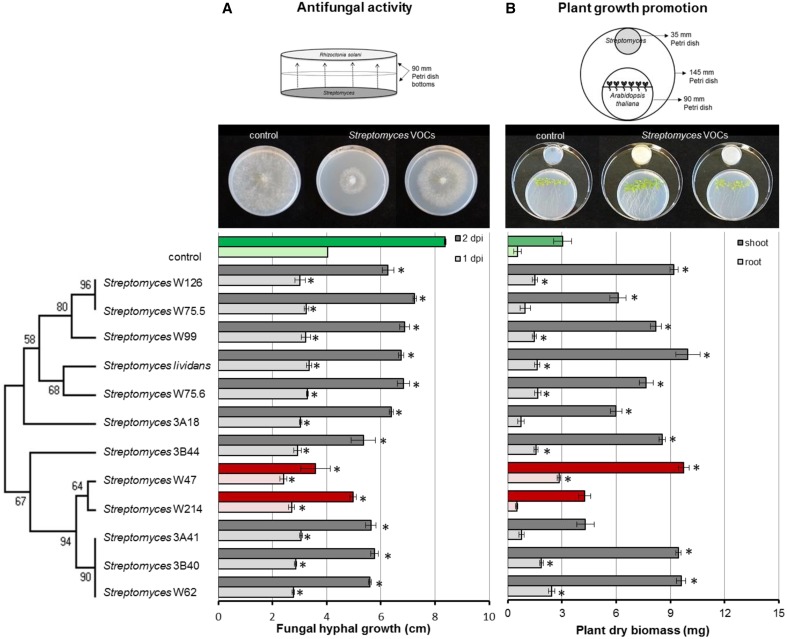
Figure 6.
Inhibition of fungal growth after 1 and 2 days of exposure to Streptomyces VOCs (A) and growth of Arabidopsis thaliana seedlings after 2 weeks of exposure to Streptomyces VOCs (B). The controls are displayed in green and isolates with the strongest antifungal activity in red. Bars represent standard errors of the mean of 3 independent biological replicates. Asterisks indicate a statistical difference as compared to controls (exposed to medium only) using Student's t-Test (p < 0.05, n = 3). Pictures of antifungal activity and plant growth promotion were made after 3 and 14 days of exposure, respectively.

