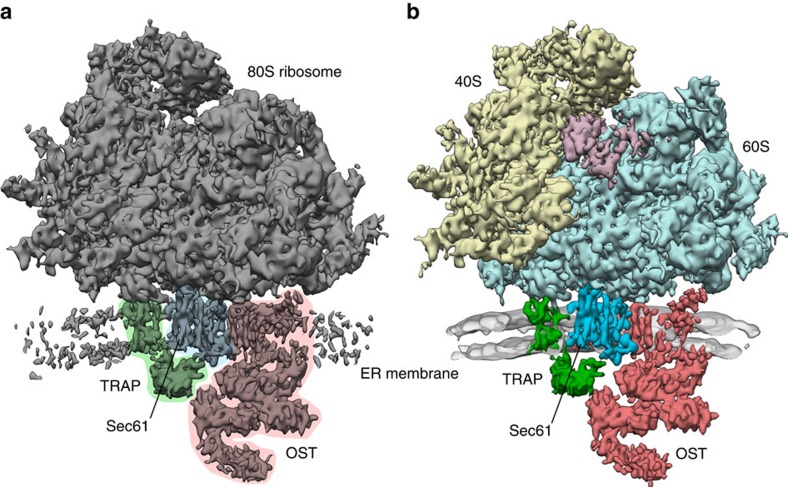
Figure 1. Overall structure of the ER membrane-associated mammalian ribosome.
(a) Subtomogram average of the ER membrane-associated ribosome filtered to 9.0 Å resolution. In the otherwise unprocessed map, TMHs for Sec61 (blue), TRAP (green) and OST (red) can be distinguished clearly in the membrane. The membrane part of the average has been cut to better visualize the membrane integral parts of the translocon. (b) Segmented densities for the 40S (yellow) and 60S (light blue) ribosomal subunits, translation elongation factors (magenta), Sec61 (blue), TRAP (green) and OST (red). Density for the ER membrane (grey) has been filtered to 2 nm resolution and was cut to emphasize the membrane integral parts of the translocon.

