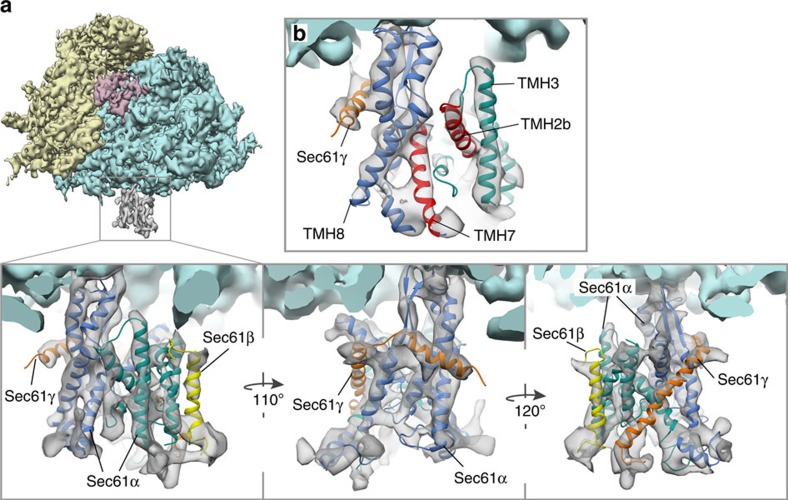
Figure 3. Atomic model of native Sec61 in the non-inserting state.
(a) Isolated densities for the 40S (yellow) and 60S (light blue) ribosomal subunits, translation elongation factors (magenta) and Sec61 (grey). In the magnified views, the flexibly fitted atomic model of the heterotrimeric Sec61 complex was superposed on the density. The N- and C-terminal halves of Sec61α (green and blue, respectively), Sec61β (yellow) and Sec61γ (orange) are depicted. (b) View focusing on the lateral gate between TMH2b and TMH7, which are highlighted in red. Density threshold and viewing angle are different from (a) for optimal visualization of the lateral gate and its surroundings.

