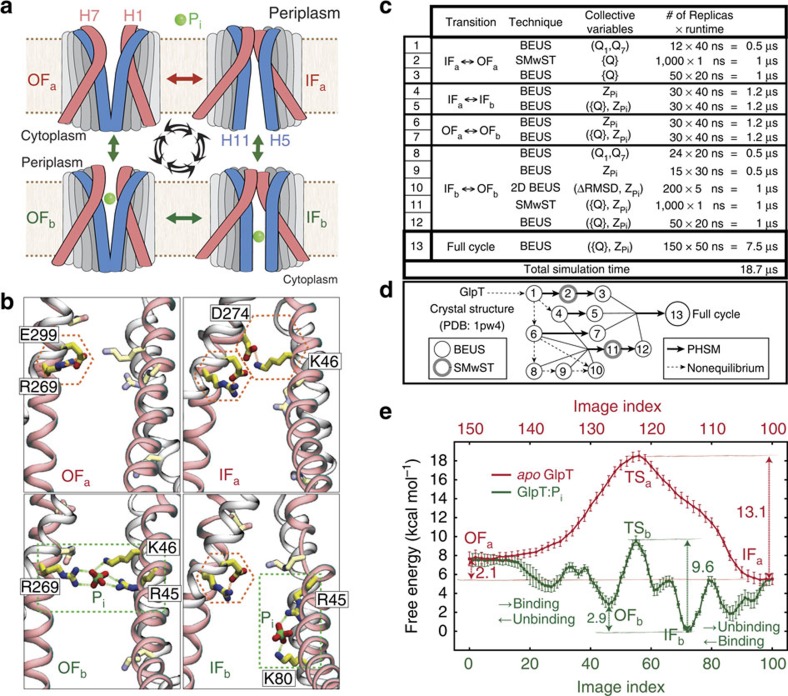
Figure 1. Thermodynamic cycle of GlpT:Pi complex.
(a) Schematic representation of the states involved in the thermodynamic cycle under study. TM helices H1/H7 (red) and H5/H11 (blue) are highlighted as representative helices involved in peri- and cytoplasmic gating, respectively. (b) Luminal charged residues involved in substrate binding (green boxes) and/or salt bridge formation (red hexagons). TM helices H1/H7 (red) and H2/H8 (grey) are shown. (c) List of the BEUS and SMwST simulations conducted to reconstruct the full thermodynamic cycle shown in a. Each replica consists of a fully atomic GlpT protein in an explicit membrane/water environment including ∼125,000 atoms. (d) Graph showing the iterative scheme used for designing the simulations shown in c. (e) Free energy profile along the simulated thermodynamic cycle shown in a based on the final simulation (set 13), involving both apo and bound GlpT. Each image (or window) represents a particular conformation of GlpT:Pi complex on a discretized cyclic transition pathway composed of 150 images defined in the ({Q}, ) space. The error bars represent the s.d. based on Bayesian block bootstrapping (see Analysis techniques in Methods section).

