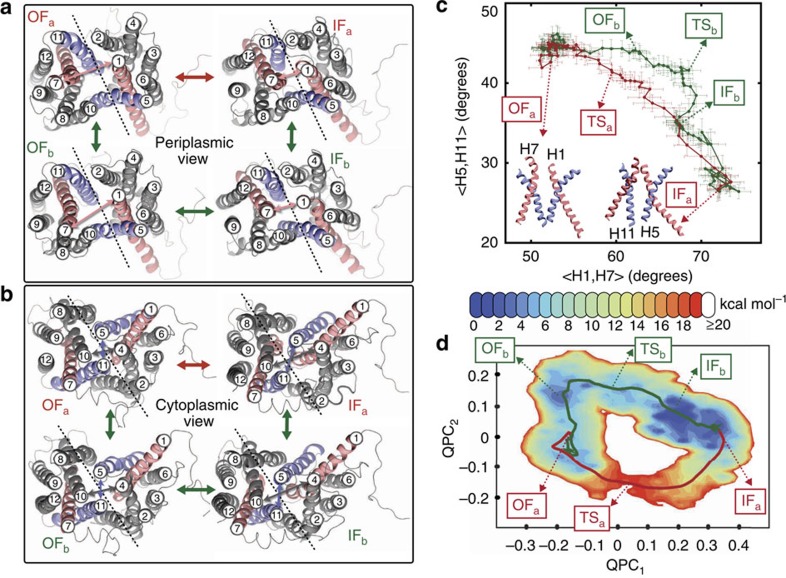
Figure 2. Global conformational changes of GlpT.
(a) Peri- and (b) cytoplasmic views of GlpT in OFa, OFb, IFb and IFa states. The dashed lines approximately represent the axis/plane of twofold pseudosymmetry. TM helices H1/H7 and H5/H11 are coloured red and blue, respectively. (c) Interhelical angle of H5/H11 helices plotted against that of H1/H7 helices. Here <A,B , in which ω is the roll axis of the helix (obtained from principal axis component analysis based on Cα atoms). <H1,H7> and <H5,H11> approximately represent the global conformational changes leading to the opening/closing of the peri- and cytoplasmic sides, respectively. The error bars represent the s.d. (see Analysis techniques in Methods section). (d) PMF in terms of (QPC1,QPC2), that is, the first two principal components of the vector parts of the {Q} quaternions. The pathways shown in c and d are based on the (unweighted) averaged centres of the 150 images (also see Fig. 1e).

