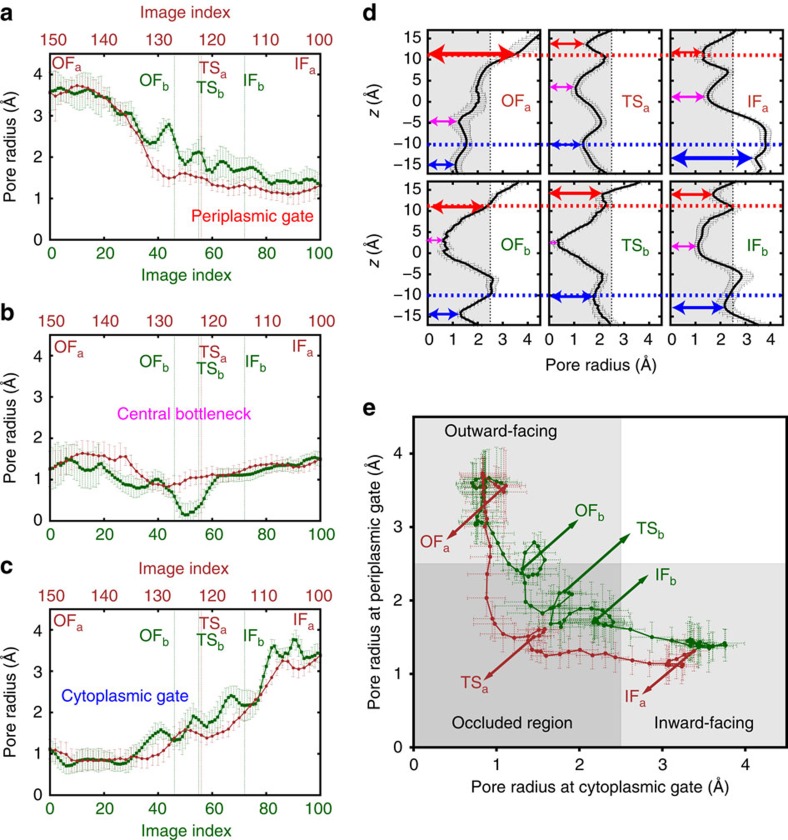
Figure 3. Alternating-access mechanism.
Pore radius at (a) periplasmic gate, (b) central bottleneck and (c) cytoplasmic gate along 150 simulated images of GlpT, averaged over sampled conformations of each image (see Supplementary Fig. 7 for the definitions and the lists of most frequently involved residues). The pore radius along the z axis (membrane normal) of each sampled conformation was measured with HOLE59 using protein and Pi atoms. (d) Pore radius along z axis shown for a select number of images. The arrows indicate the peri- (red) and cytoplasmic (blue) gates as well as the central bottleneck (magenta) used in panels a–c. (e) Pore radius at peri- and cytoplasmic gates. In both apo and bound GlpT, the IF↔OF transition occurs by visiting an occluded region in which both gates are closed to the substrate. The error bars represent the s.d. (see Analysis techniques in Methods section).

