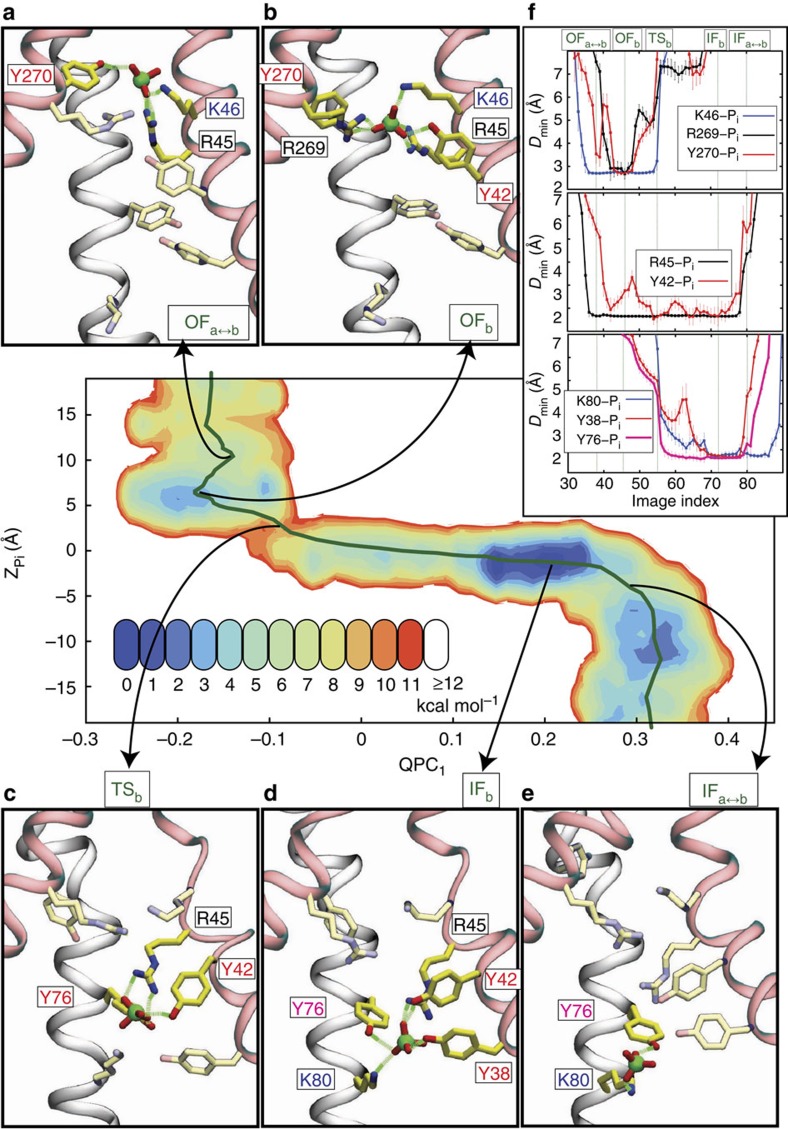
Figure 4. Substrate binding, translocation and unbinding coupled to protein conformational changes.
PMF in the (QPC1, ) space is shown for the regions in which Pi is present in the lumen. (a–e) Snapshots of the binding site conformation at a select number of images representing the early stages of binding/unbinding in the peri- (a) and cytoplasmic (e) sides, the fully-bound OFb (b) and IFb (d), and the TSb transition state c. (f) Dmin (minimum hydrogen donor-acceptor distance) between the Pi and side chains shown in a–e, grouped into three classes based on the functional state in which they interact with the substrate: OF state (top panel), IF state (bottom panel) and both states (middle panel). The residues shown in a–e are those strongly interacting with Pi (defined by Dmin<3 Å) at least at one image. Dmin of each image is an unweighted average over all sampled conformations of the image. The error bars represent the s.d. (see Analysis techniques in Methods section).

