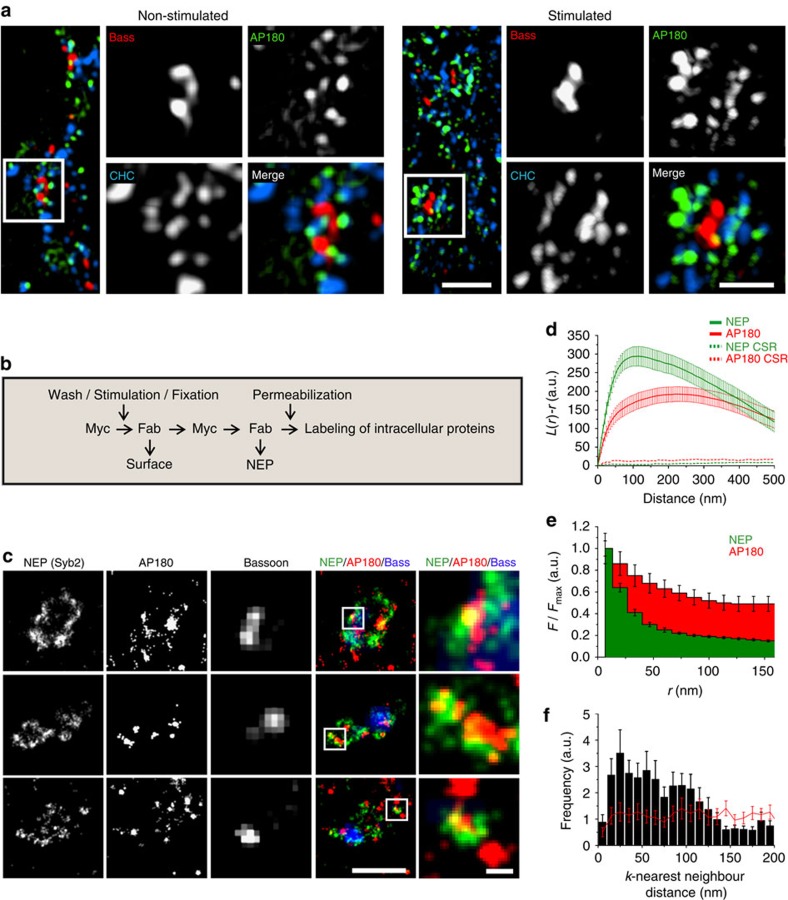
Figure 6. Newly exocytosed proteins co-cluster with endocytic proteins in the periactive zone.
(a) 3D-Structured Illumination Microscopy (3D-SIM) analysis of Bassoon (Bass), AP180 and clathrin heavy chain (CHC) in stimulated (40 APs, 20 Hz) or non-stimulated hippocampal neurons. Scale bar, 1 μm; zoom, 500 nm. (b) Schematic for immunolabeling of the newly exocytosed SV protein pool (NEP). (c–e) SD-dSTORM imaging of newly exocytosed SV proteins (stimulation: 40 AP, 20 Hz) in hippocampal neurons expressing Syb2-c-myc. (c) 2-colour SD-dSTORM analysis of NEP and AP180, overlaid with wide-field image of Bassoon. Scale bar, 1 μm; zoom, 100 nm. (d) Ripley's L(r)-r function shows sub-synaptic clustering of NEP and of AP180, indicated by positive L(r)-r values with a maximum at radii of about 100 nm (NEP) and 200 nm (AP180). Mean±s.e.m.; n=31 synapses. Dotted lines represent upper envelopes of complete spatial randomness (CSR). (e) Radial intensity profiles of NEP and AP180 signals centred on the maxima of sub-synaptic NEP clusters show colocalization of both proteins (mean±s.e.m.; n=47 synapses). (f) k-Nearest neighbour analysis (k=10) of NEP and AP180 showing a maximum at 25 nm. The red line represents results after toroidal shift of one channel. Values above the red line indicate colocalization of NEP and AP180 (mean±s.e.m.; n=31 synapses).

