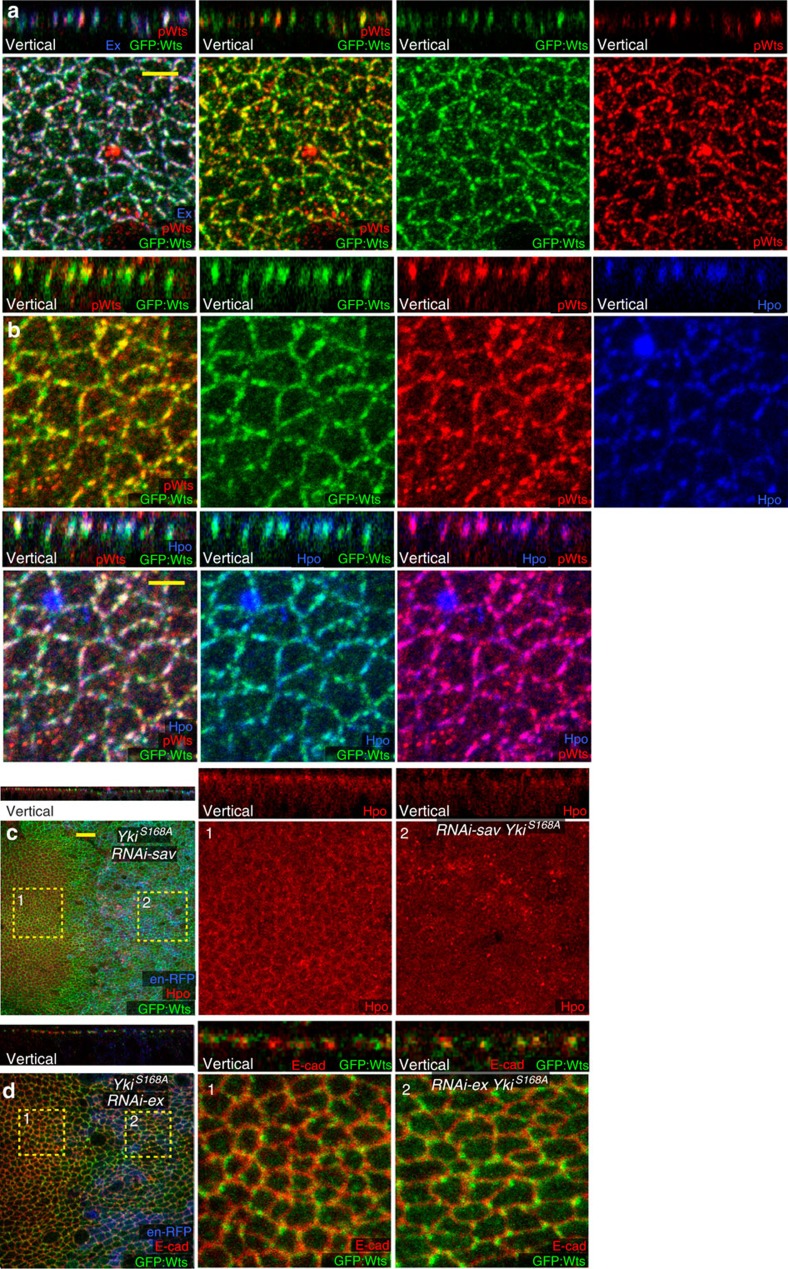
Figure 3. Localization of Wts activation in vivo.
(a,b) Posterior wing disc cells expressing YkiS168A for 24 h under en-Gal4 control, including combined and individual stains as indicated, in horizontal and vertical (as marked) sections; scale bar (yellow), 3 μm. Panels show expression of: (a) Ex (blue), pWts (red), GFP:Wts (green), (b) Hpo (blue), pWts (red) and GFP:Wts (green). (c,d) Wing disc cells with YkiS168A and RNAi-sav (c) or RNAi-ex (d) expressed in posterior cells for 24 h under en-Gal4 control, marked by UAS-RFP (blue), including combined and individual stains as indicated, in horizontal and vertical (as marked) sections, panels marked by numbers show higher magnification of the boxed regions (−1 for anterior cells, −2 for posterior cells); scale bar (yellow), 3 μm. Panels show expression of: (c) Hpo (red), GFP:Wts (green), (d) E-cad (red) and GFP:Wts (green).

