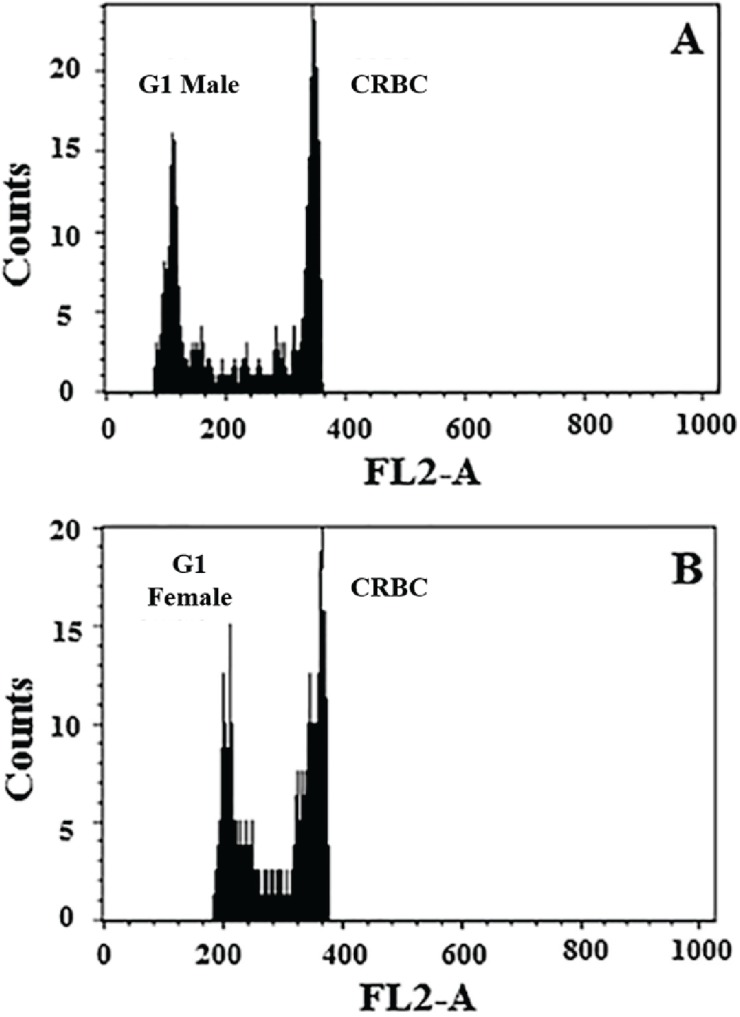
Figure 2.
Flow cytometric estimation of the nuclear DNA content of haploid male and diploid female B. tabaci MEAM1. Histograms represent relative fluorescence of stained nuclei of male (A) and female (B) whiteflies relative to the internal standard, chicken red blood cells (CRBC). X-axis = relative nuclear DNA content; Y-axis = number of nuclei.

