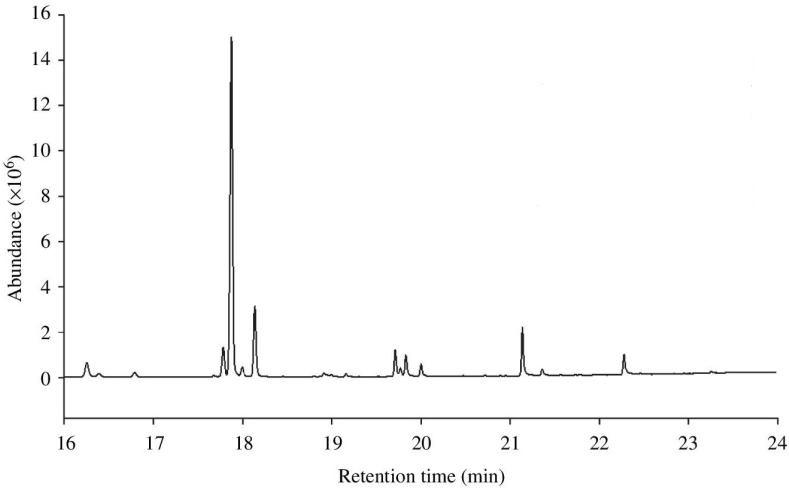
Figure 1.
Example of a typical gas chromatograph output from a sample of Drosophila simulans CHCs. Each peak represents a different CHC component of the CHC profile, and the integrated peak area gives the abundance of that CHC in the sample. Smaller, relatively volatile CHCs have a lower retention time, and therefore appear first on the chromatograph, as they vaporize and are separated more quickly than larger, more stable CHC molecules.

