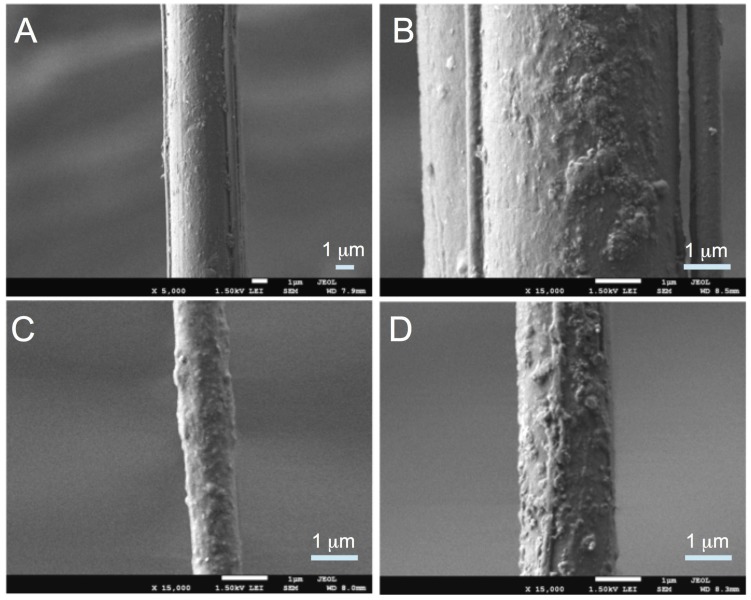
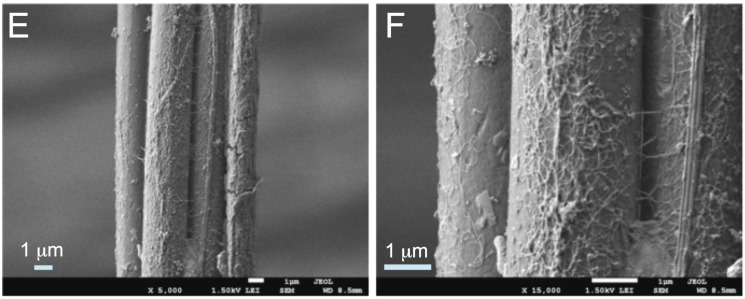
Figure 2.
SEM images of spider silk. The controls are shown in (A,B) at two different magnifications, namely ×5000 and ×15000, respectively. The specimens that are irradiated at 10 min and 20 min are shown in (C,D), respectively. The images in (E,F) are from specimens irradiated at 30 min, shown for two different magnifications, namely ×5000 and ×1500, respectively.


