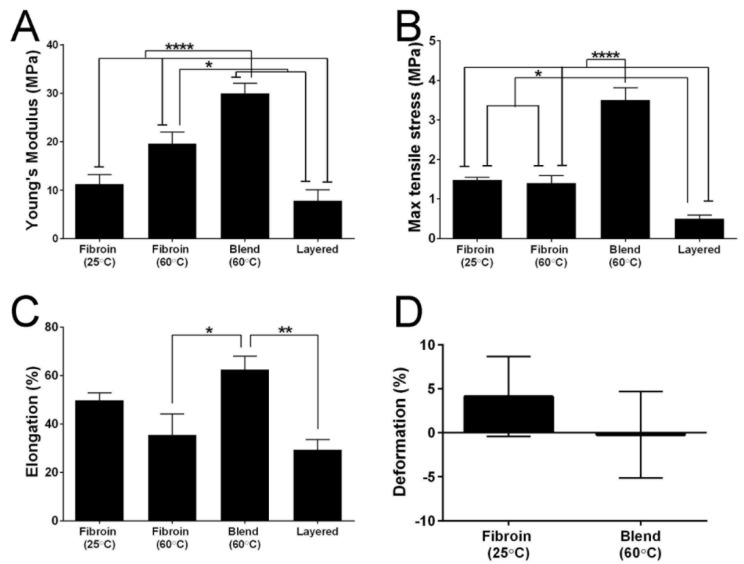
Figure 7.
Quantitative comparison of the tensile properties of biomaterial membranes. (A) Young’s modulus; (B) maximum tensile strength; (C) elongation to break; and (D) deformation/recoil capacity after 200 cycles. Bars represent mean values ± standard error of the mean. Asterisks indicate differences are statistically significant (* p < 0.05, ** p < 0.01, **** p < 0.0001).

