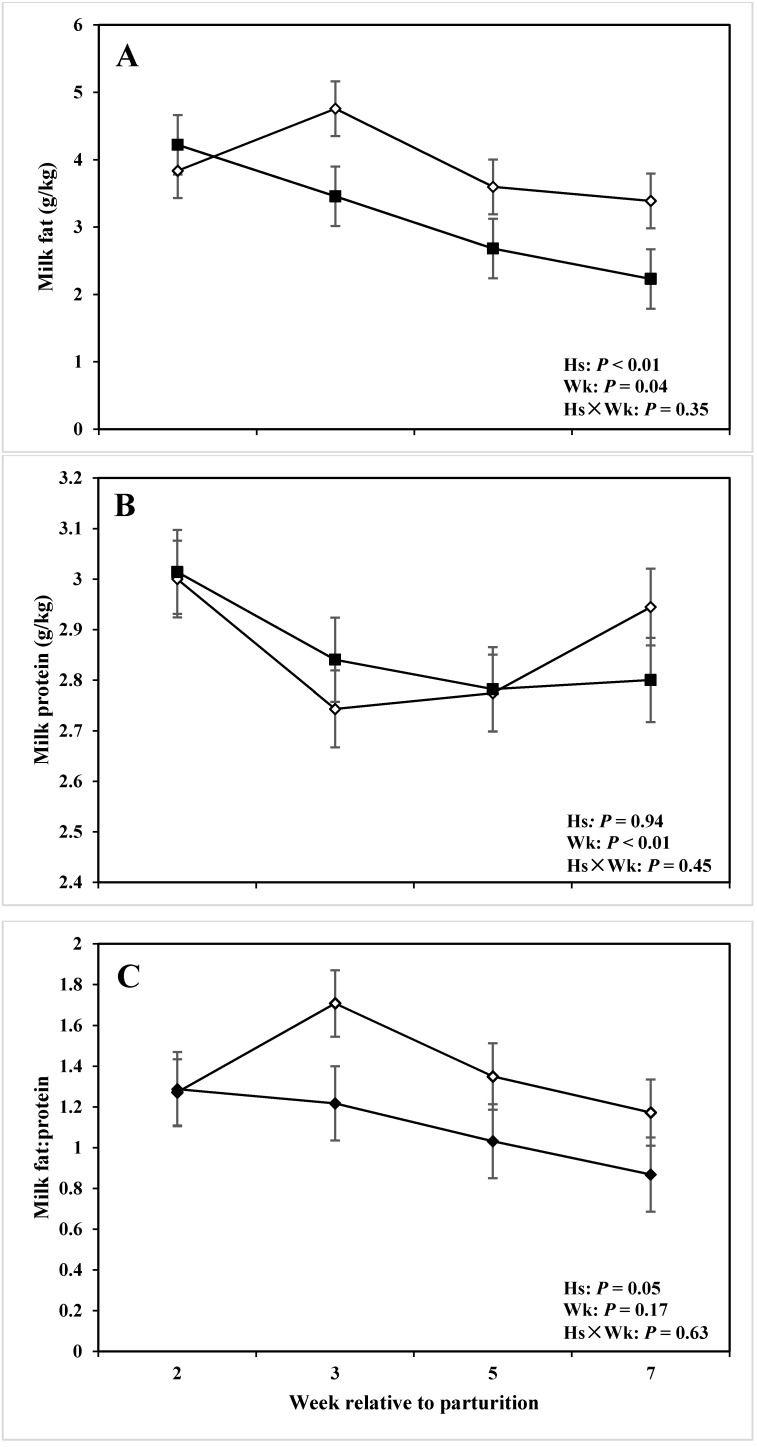
Figure 5.
Concentration of (A) fat, (B) protein, and (C) fat-to-protein ratio in the milk of periparturient dairy cows with (■, n = 6) or without (◇; n = 6) lameness (LSM ± SEM; Hs = effect of health status; Wk = effect of sampling week; Hs × Wk = effect of health status by sampling week interaction).

