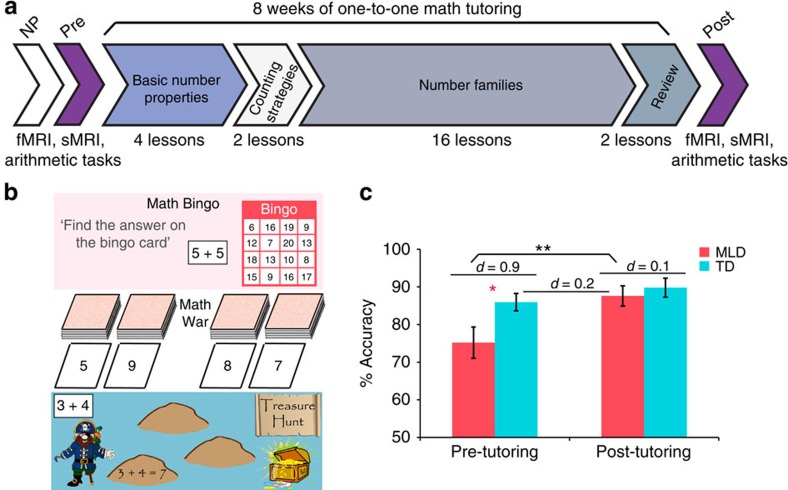
Figure 1. Overall study design, math games and behavioural results.
(a) Before 8 weeks of tutoring, all children underwent an extensive battery of neuropsychological (NP) assessments for IQ, academic achievement, and working memory. Before tutoring, each child underwent a functional MRI (fMRI) scan session during which they had to verify addition equations—Addition task (that is, 3+4=7), and assess the validity of number identity expressions—Control task (that is, 7=7). High-resolution structural MRI (sMRI) images were also acquired in each participant for anatomical co-registration. During this session, and before entering the scanner, children also performed an arithmetic production task (that is, 4+3=?). On successful completion of the aforementioned sessions, children went through an intensive 8-week, 1:1 tutoring program focused on conceptual aspects of number knowledge and speeded practice on efficient counting strategies and systematic learning of number families (that is, all the problems that summed to 5, and the corresponding subtraction problems). After 8 weeks of tutoring all children underwent a second MRI scan session. (b) Examples of the physical math games used in the tutoring: Math Bingo—in which the child has to calculate the sum of a given problem and verify whether the answer is on their Bingo card; Math War—in which the child competes with the tutor to get the highest sum from their decks of cards; and Treasure Hunt—in which the child has to calculate the answer of a given problem, and write down both the equation and its correct solution on the stepping stones of the ‘treasure map' to get to the treasure chest. (c) Performance normalization on the arithmetic problem-solving task in children with MLD (n=15) after 8 weeks of math tutoring, plotted against TD (n=15) children's performance at pre- and post- tutoring sessions. Error bars indicate one s.e.m. *P<0.05; **P<0.01, significant by independent samples t-test. Effect sizes for group differences are shown as Cohen's d.

