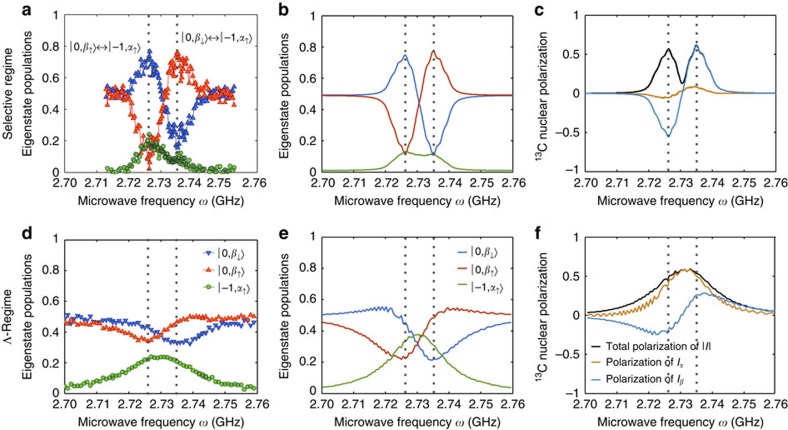
Figure 2. Hyperpolarization of a first-shell nuclear spin using a MW-driven, optically pumped nitrogen-vacancy centre.
Experiments were conducted by orienting a magnetic field  =4.04 mT at θ≈42° and φ≈85° polar and azimuthal angles with respect to the zero-field tensor D0 of the NV centre. The effective 13C Larmor is then δ≈8.8 MHz, while the first-shell hyperfine interaction is Δ≈130 MHz. Two MW power strengths were calibrated corresponding to Rabi frequencies of Ω≈1.4 MHz<8.8 MHz≈δ (a–c) and Ω≈11.9 MHz>8.8 MHz≈δ (d–f) corresponding to the selective and the Λ-regime, respectively. Blue, red and green colours represent the states
  ,
,  and
and  respectively. (a,d) Optically detected experiments determining the eigenstate populations at the end of the polarization phase during 30 μs as a function of the MW frequency ω. (b,e) Predicted eigenstate population spectra calculated without free parameters, that is, using calibrated and known couplings, and a hyperfine tensor was taken from ref. 29. In the selective regime (a–c), the
  population spectrum exhibits two peaks corresponding to the
  transition frequencies, whereas in the Λ-regime (d–f) the
  population spectrum has a single peak centred half-way between the
  transition frequencies. (c,f) Derived 13C polarization spectra confirming the polarization directions along the
  -state axis (c) and the
  -state axis (f) for the selective and Λ-regimes, respectively.

