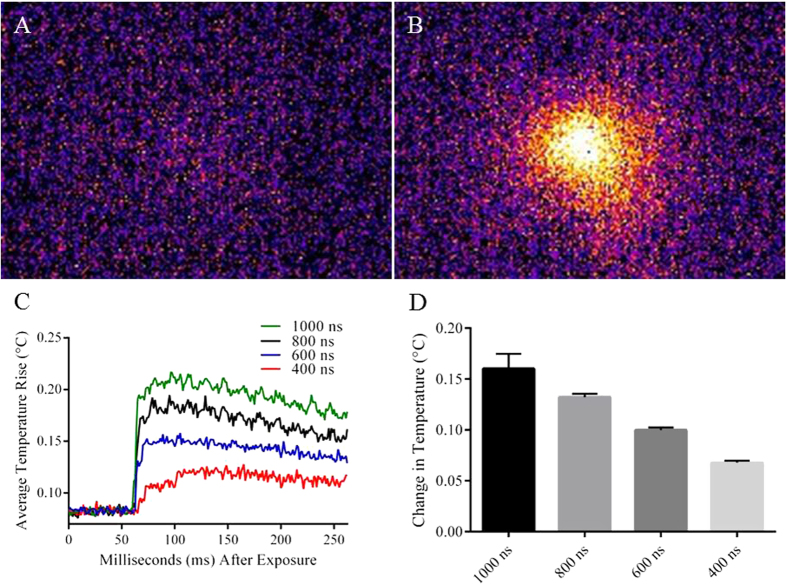
Figure 2. Thermal Profile of nsEP.
(A) FLIR image of nsEP electrodes before the application of a single nsEP pulse. (B) FLIR image of nsEP electrodes 1.25 ms post exposure. (C) Traces of average temperature rise at the electrodes with either 1000, 800, 600, or 400 ns pulse delivered (D) Average change in temperature with either 1000, 800, 600, or 400 ns pulse. Error bars represent the standard error of the mean (SEM). A single 600 ns pulse causes a temperature increase of approximately 0.1 °C at 1.25 ms post exposure. Tukey’s multiple comparison test was performed, each data set was found to be significantly different form each other. Siginificance was not noted on the figure for simplificaiton purposes. P-values, 1000 ns vs. 800 ns(<0.005), 1000 ns vs. 600 ns (<0.000005), 1000 ns vs. 400 ns (<0.000005), 800 ns vs. 600 ns (<0.005), 800 ns vs. 400 ns (<0.000005), and 600 ns vs. 400 ns (<0.005). Note, the FLIR camera used for this experiment has a frame rate of 800 frames/second, therefore the initial maximal temperature spike may not have been captured.

