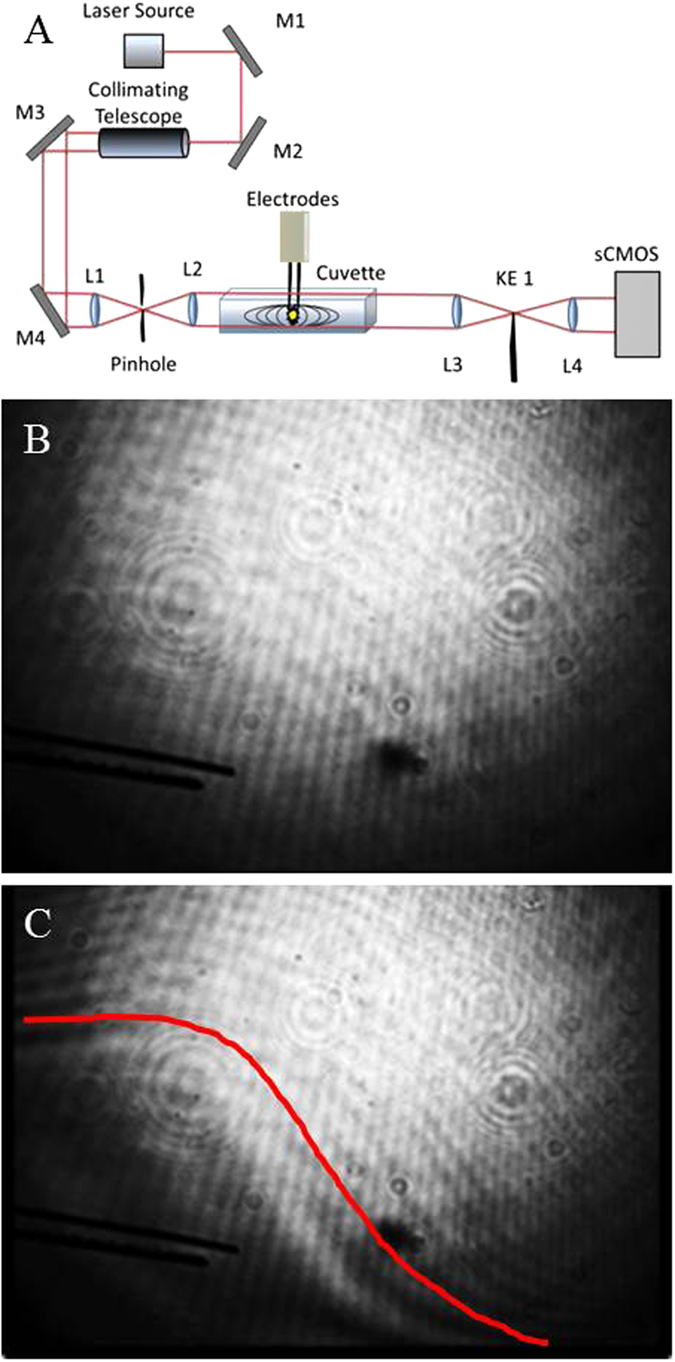
Figure 5. Schlieren image of the pressure transient.

(A) Schematic of Schlieren setup with respect to the nsEP exposure setup. (B) Schlieren image taken before a single nsEP pulse, (C) Schlieren image of pressure transient immediately after a single 600 ns pulse at 13.1 kV/cm. The pressure transient (outlined by red line) can be seen, propagating away from the electrode. Drawing in Figure A was drawn by LCM.
