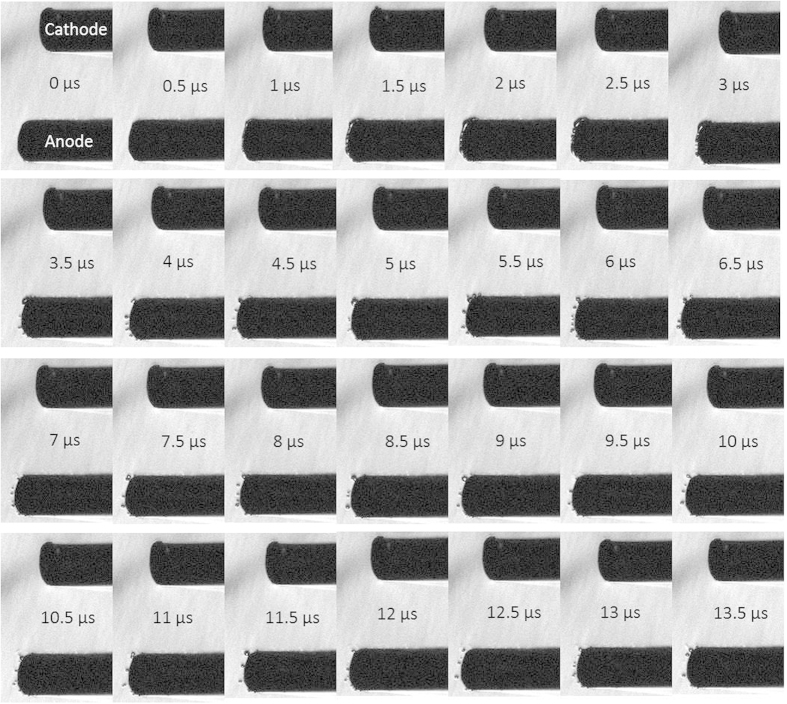
Figure 6. Pump-probe laser imaging of nsEP electrode pulsed at 600 ns and at 13.1 kV/cm.
Collage of images captured at the time of the exposure (0 μs), during the pulse (0.5 μs) and after the pulse. A corona formed around the edge of the electrode (anode), at 1.5 μs after the initalion of the pulse. The corona existed for approximately 1.5 μs, eventually leading to the formation of microbubbles. These microbubble persisted for >10 μs.

