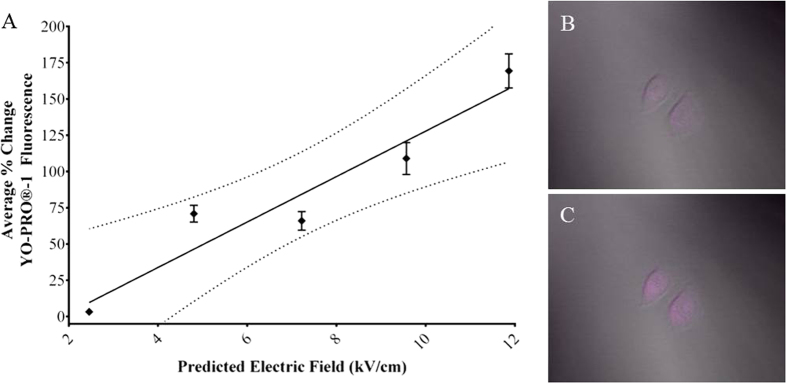
Figure 7. Effect of electric field on increase in YO-PRO®-1 fluorescence after nsEP exposure.

(A) Nanoporation, as indicated by increases in YO-PRO®-1 fluorescence after nsEP exposure, increases linearly with increases in the electric field. The values are plotted as an average change in fluorescence intensity (error bar represent ± SEM). Solid line represents the best fit from a linear regression preformed in GraphPad Prism 6. The dotted lines represent the 95% confidence interval. (B) Image of CHO-K1 cells stained with YO-PRO®-1 before a typical nsEP exposure. (C) Image of same cells 25 seconds post exposure.
