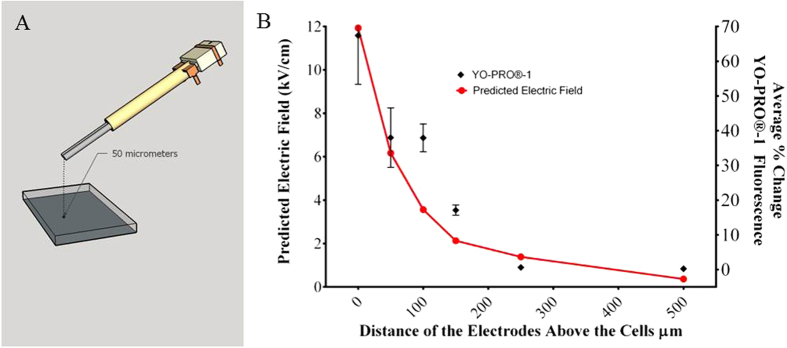
Figure 8. Effect of electrode height, relative to the cells, on YO-PRO®-1 fluorscence.

(A) The majority of our typical nsEP exposures occur with the delivery electrodes being placed 50 μm above the cells to be exposed. This figure shows the relative position of the electrodes in a typical exposure. (B) We exposed CHO-K1 cells with a typical 600 ns pulse at 12 kV/cm and at varying electrode heights ranging from 0 μm to 500 μm above the cells. The predicted electric field, modeled by FEM is plotted in red on the left Y axis. Nanoporation, as indicated by the level of YO-PRO®-1 fluorescence change after the application of the nsEP (right Y axis) is plotted against the cooresponding height of the electrodes. The values are plotted as an average change in fluorescence intensity (error bar represent ± SEM). The level of nanoporation follows the intensity of the electric field. Drawing in Figure A was drawn by CCR.
