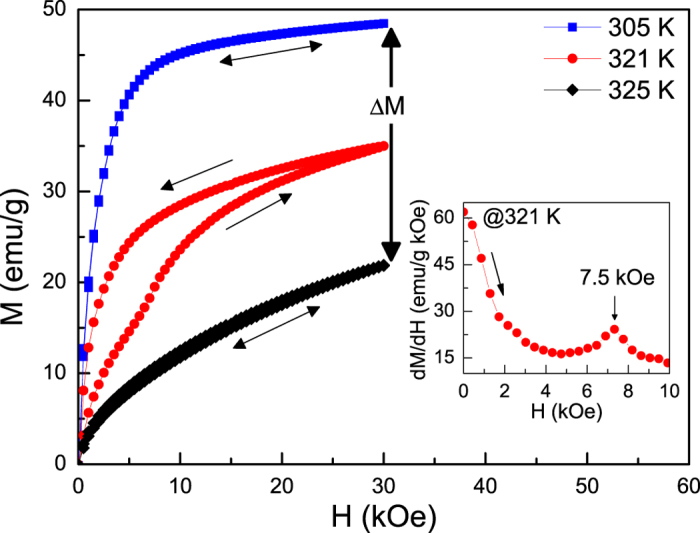
Figure 5. Isothermal magnetization curves for Ni55.8Mn18.1Ga26.1 measured at selected temperatures.

Prior to measurements, the sample was first warmed in zero fields to pure austenite and then cooled to measuring temperature. The inset shows a peak value on the dM/dH(H) curve measured at 321 K. Arrows indicate the directions of magnetic field change.
