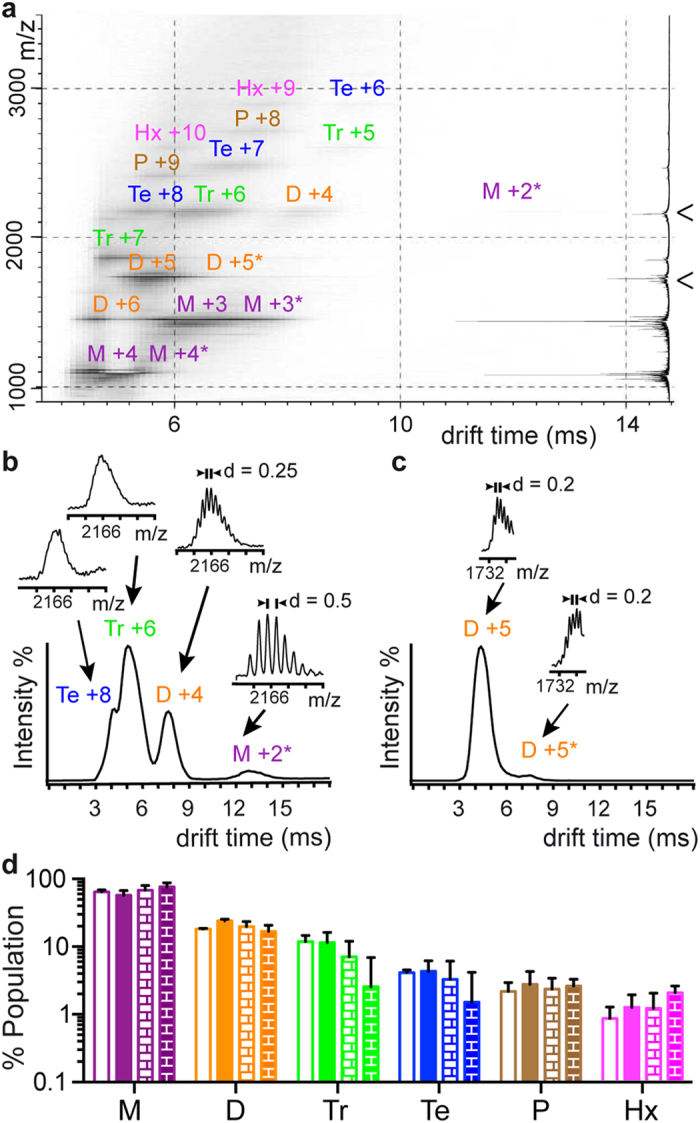
Figure 3. ESI-IM-MS analysis reveals that Aβ40 and Aβ42 oligomerize predominantly through dimers and trimers.

(a) ESI-IM-MS spectra for LMW Aβ40. M = monomers, D = dimers, Tr = trimers, Te = tetramers, P = pentamers, and Hx = hexamers. The number adjacent to each aggregation state refers to the charge state of the ion. The summed m/z spectrum is shown on the right. Projections of the ESI-IM-MS spectra on the drift time axis for (b) m/z 2166 (M +2, D +4, Tr +6, and Te +8) and (c) m/z 1732 (D +5), both indicated by an arrowhead in (a). For each of the mobility peaks detected, their associated m/z spectrum is also shown. Peaks were assigned following the considerations described in the Supplementary Text. ESI-IM-MS analysis of LMW_CL Aβ40, LMW Aβ42, and LMW_CL Aβ42 samples is shown in Supplementary Figs S3–S5, respectively. Relative population of M (purple), D (orange), Tr (green), Te (blue), P (brown), and Hx (pink) in LMW Aβ40 (empty bars), LMW Aβ42 (filled bars), LMW_CL Aβ40 (empty brick pattern bars) and LMW_CL Aβ42 (filled bricked pattern bars) samples obtained from (d) the intensity counts of all charge states detected in ESI-IM-MS spectra.
