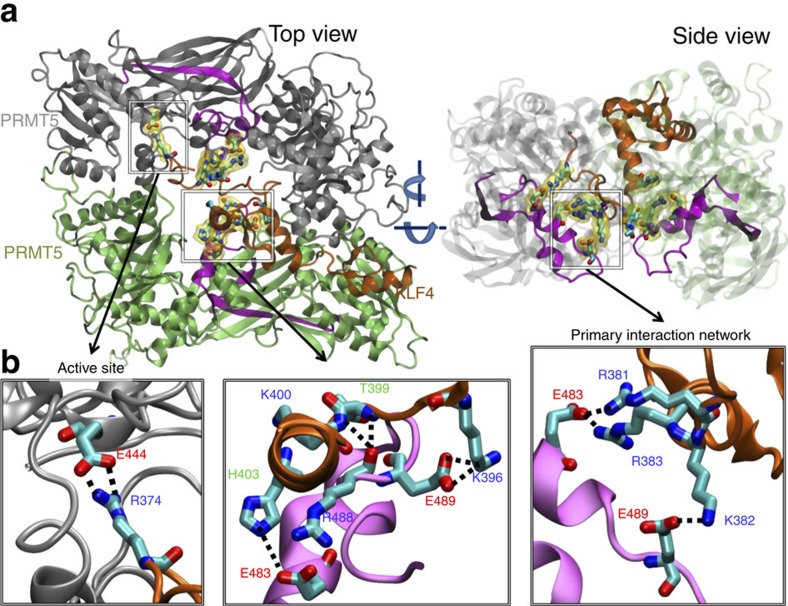
Figure 3. PRMT5-KLF4 complex and interaction between them.
(a) Top and side views of the complex obtained from the first run (after 230 ns MD simulation) is shown at the upper part. PRMT5s are shown in grey and lime. The experimentally predicted interaction region on PRMT5 is shown in magenta. KLF4 is shown in orange. In lower panel (b) on the left the interaction between KLF4 residue R374 and PRMT5 residue E444 at the active site is shown. In the lower middle panel interactions between Zf1 (excluding the experimentally predicted binding region) and the experimentally predicted PRMT5 binding region are shown. On the lower right panel the primary interaction network, which is closely located to the methylation sites of KLF4, between the experimentally predicted binding regions is shown. Interacting residues are shown in licorice representation and colored according to their atom types. In panel (a), these residues are further highlighted with transparent yellow surface representations.

