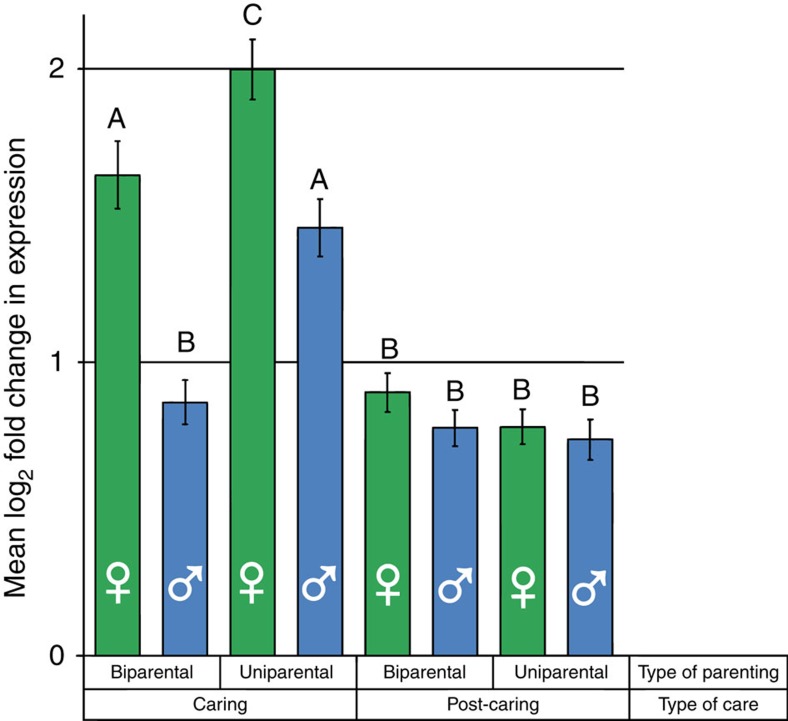
Figure 4. Extent of differential expression of the caring gene set under different family social conditions, measured by log-fold difference in expression.
Groups with significantly different (Tukey’s HSD P<0.05) change in gene expression are marked with different letters. Analyses are based on two biological replicates per treatment.

