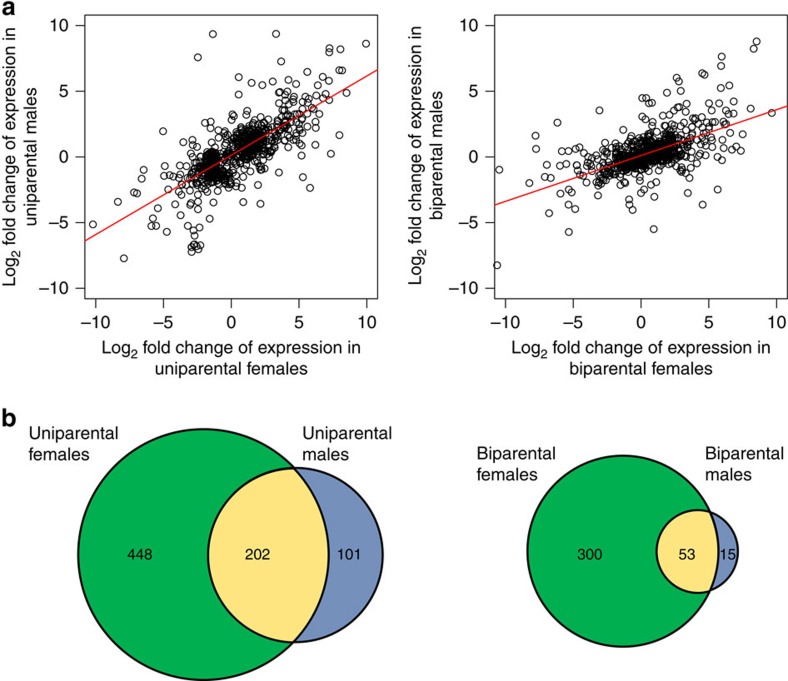
Figure 5. Correlation between gene expression of males and females under different family social conditions.
(a) Correlation of male and female gene expression change in caring versus control comparisons in the caring gene set in uniparental and biparental conditions. (b) The number of differentially expressed (DE) genes for males and females in caring versus control comparisons in the caring gene set and the number shared in uniparental or biparental conditions (yellow areas). Note that only genes that were DE in the same direction were included in the region of overlap.

