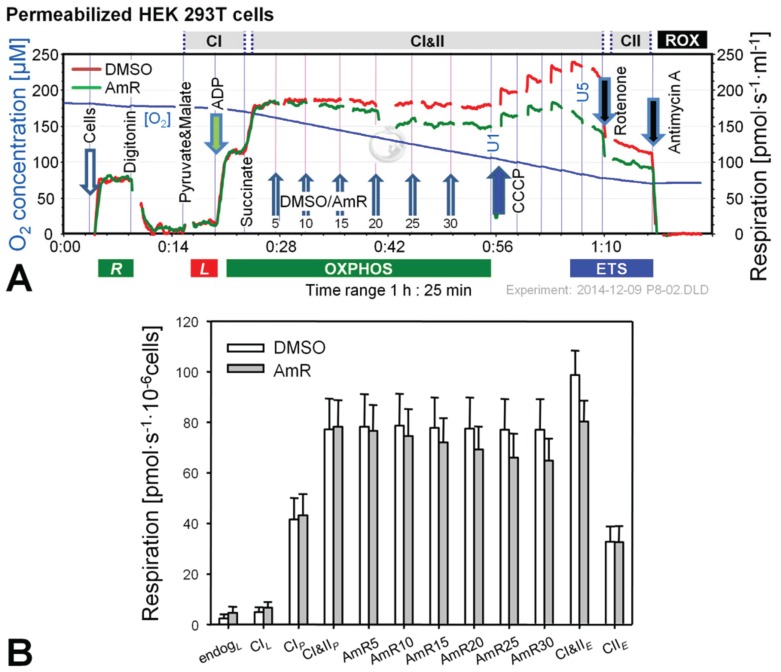
Figure 2.
Effect of AmR on respiration of permeabilized HEK 293T cells. (A) Representative experiment with AmR (green plot) or carrier DMSO (red plot) titrated in the CI&II-linked OXPHOS state. Substrate states and coupling states are shown by horizontal bars. Numbers indicate final Amp concentrations [µM]; U1 and U5 indicate final uncoupler concentrations [µM] added in 1 µM steps; (B) Oxygen flow [pmol∙s−1·10−6 cells], mean ± SE of N = 5 independent cultures, each measured in duplicate (n = 2).

