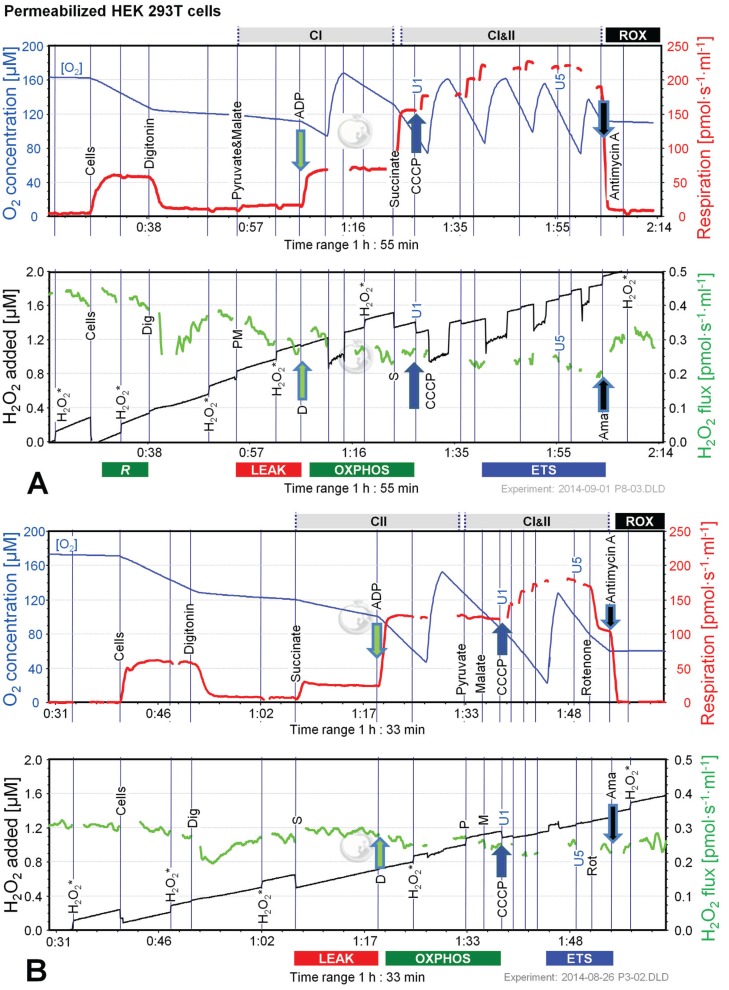
Figure 3.
Combined determination of oxygen consumption and H2O2 flux by O2k-Fluorometry in permeabilized HEK 293T cells. (A) Respiration and fluorescence changes using P and M as initial substrates; (B) Respiration and fluorescence changes using succinate (S) as initial substrate. Respirometric measurements are shown in the upper panels as described in Figure 1. U1 and U5 indicate final uncoupler concentrations [µM] added in 1 µM steps. In the lower panels the black plots show the fluorescence signal. H2O2* indicates titrations of 0.1 µM H2O2 for calibration, to convert the fluorescence signal to an equivalent H2O2 concentration (left Y-axis [µM]). Plots are shown on the basis of the first calibration with H2O2. The positive time derivative yields the volume-specific H2O2 flux shown as the green plots (right Y-axis [pmol·s−1·mL−1]).

