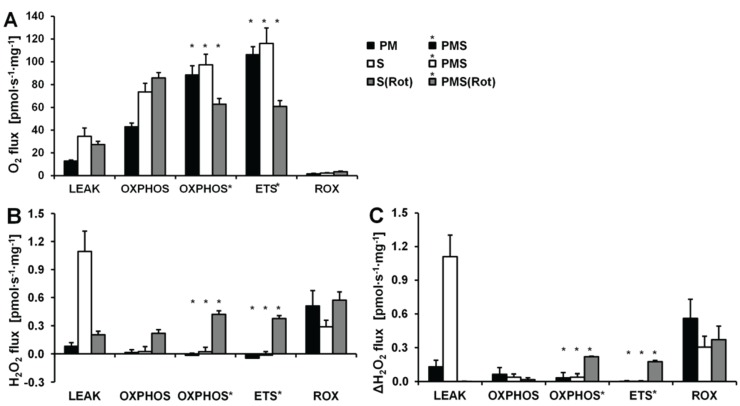
Figure 7.
Respiration and H2O2 flux in mouse brain homogenate in SUIT protocols using PM (black bars), S (white bars) and S(Rot) (grey bars) as initial substrates. (A) Oxygen flux. (B) H2O2 flux corrected for the slope determined in the absence of homogenate; (C) H2O2 flux corrected for minimal observed slope. The fluorescence signals were calibrated using the H2O2 titrations at the corresponding state (Figure 6). Bars are means ± SD of 3 animals, each measured in duplicate.

