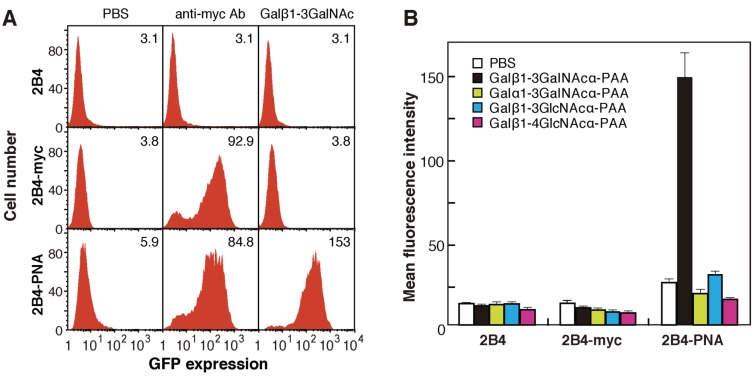
Figure 2.
Reporter assays of PNA-expressing 2B4 cells. (A) Fluorescence-activated cell sorting (FACS) analyses of GFP expression in myc-tagged PNA-expressing (2B4-PNA), myc-tag-expressing (2B4-myc), and untransfected 2B4 cells grown on wells coated with anti-myc antibody (middle panels), Galβ1-3GalNAc-PAA (right panels), or PBS as a control (left panels). The numbers in each panel indicate the mean fluorescence intensity; (B) Reporter assay of GFP expression in 2B4-PNA cells grown on wells coated with several disaccharide-PAAs. The data are represented as the mean ± SD of n = 3 independent experiments.

