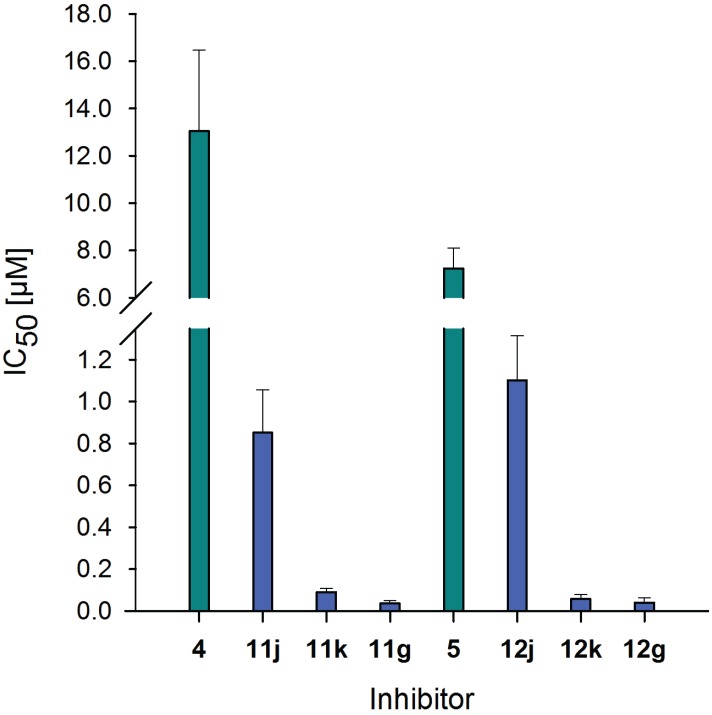
Figure 7.
IC50 values of soluble tetrasaccharides and neo-glycoproteins. IC50 values of neo-glycoproteins 11j, 11k, 11g, 12j, 12k and 12g () are compared with those of free tetrasaccharides 4 and 5 () for 5 µM galectin-3 binding on ASF. Lower values indicate higher inhibitory potencies. IC50 values in [µM] were calculated using Sigma Plot software.

