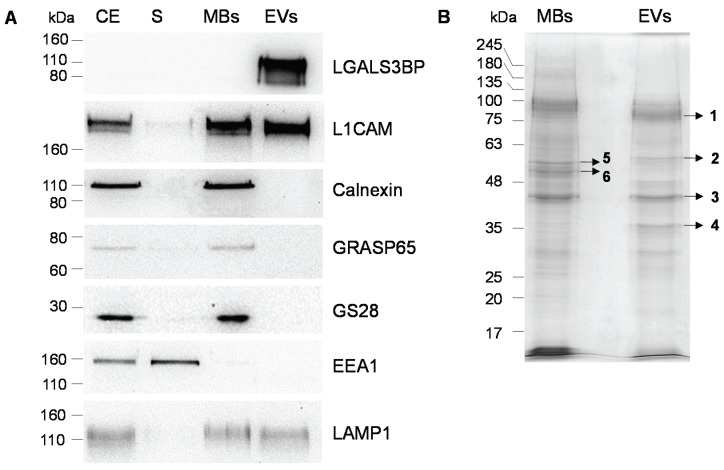
Figure 2.
Comparison of protein profiles of MBs and EVs from OVMz cells. (A) Immunoblotting of cellular extracts (CE), post-100,000 g supernatant from MBs isolation (S), MBs and EVs. Ten µg of total protein were applied per lane with the exception of EVs in the incubation with LGALS3BP where three µg of total protein were used. Detection was by the chemiluminescent method. Results were representative of three experiments; (B) SDS-PAGE analysis of proteins of MBs and EVs. Ten µg of protein were applied per lane. Protein detection was with Coomassie R-250.

